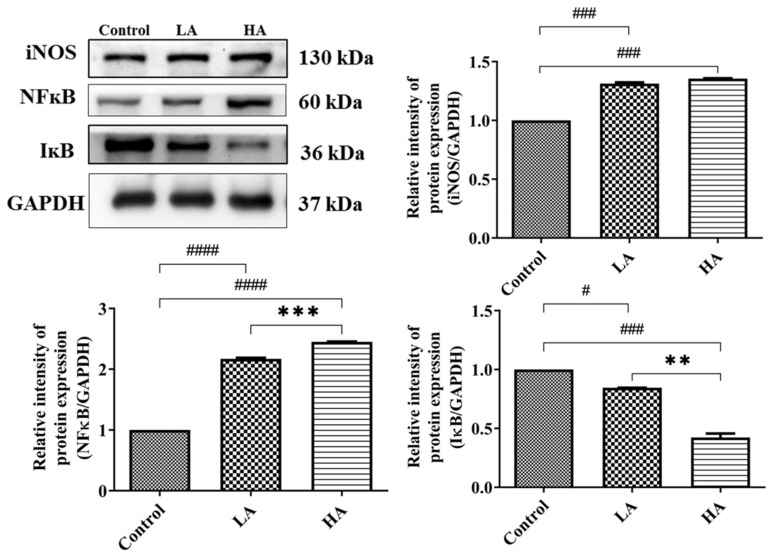
Figure 6.
Western blot analysis of inflammatory response protein expression in rats’ cerebral cortex after oral administration of aspartame at different levels. Rat groups: control diet (control), low dose of aspartame (LA), high dose of aspartame (HA). Data are presented as mean ± SD. # p < 0.05, ### p < 0.001, #### p < 0.0001 in comparison with control group; ** p < 0.01, *** p < 0.001 when compared between groups by a one-way ANOVA with Bonferroni’s post-test correction.

