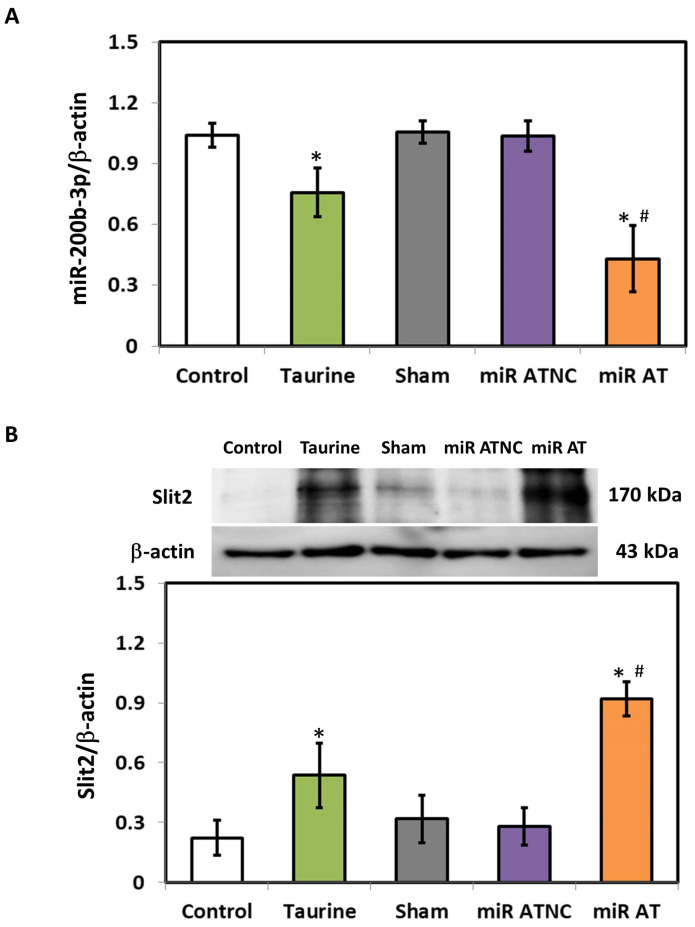
Figure 2.
Expression of miR-200b-3p and Slit2 protein in SHR treated with miR-200b-3p antagomir. (A) miR-200b-3p and (B) Slit2 protein in the striatum of SHR from different groups (n = 5 per group). Data are shown as mean ± S.D. The symbols, * p < 0.05, and # p < 0.05, indicate significant differences compared with the Control group and Sham group, respectively, using one-way ANOVA with Tukey’s multiple comparisons post hoc test. Control (fed with Cho diet); Taurine (fed with 45 mM taurine); Sham (fed with Cho diet); miR ATNC (injection of miR-200b-3p antagomir negative-control); miR AT (injection of miR-200b-3p antagomir).

