Figure 3.
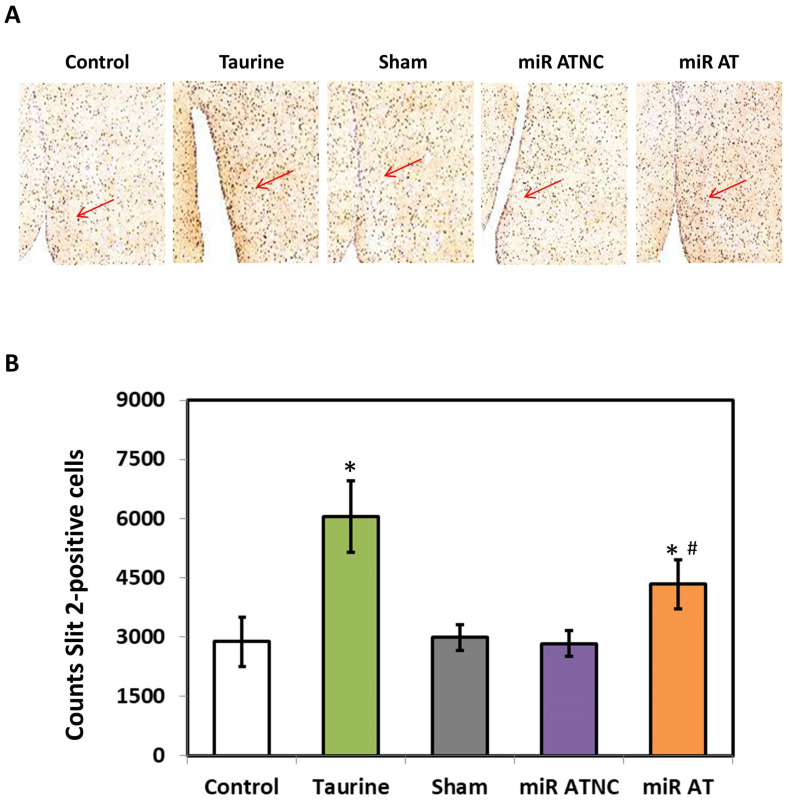
Immunohistological stainings for Slit2 proteins. (A) Representative images of the striatal section with immunohistological stainings of SHR with different treatments (n = 5 per group). The arrow indicates the expression of Slit2 proteins. (B) Quantified results for Slit2 protein expression. The symbol, * p < 0.05, and # p < 0.05, indicate significant differences compared with the Control group and Sham group, respectively, using one-way ANOVA with Tukey’s multiple comparisons post hoc test. Control (fed with Cho diet); Taurine (fed with 45 mM taurine); Sham (fed with Cho diet); miR ATNC (injection of miR-200b-3p antagomir negative-control); miR AT (injection of miR-200b-3p antagomir).

