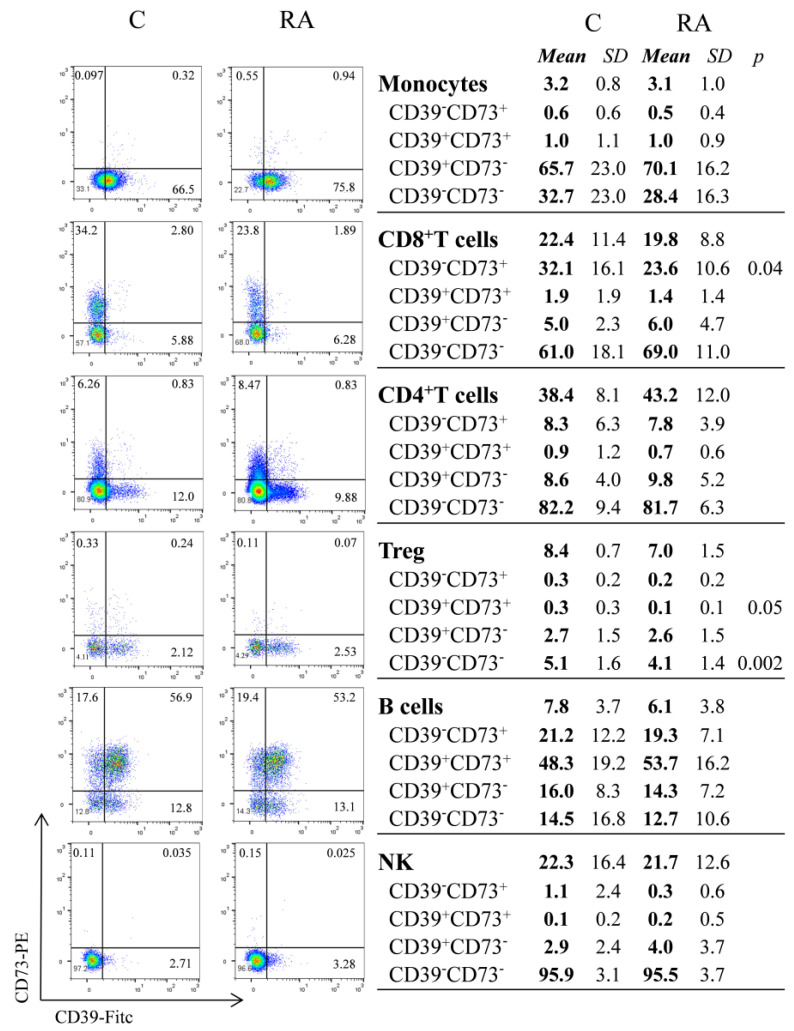
Figure 1.
Flow cytometric analysis of CD39 and CD73 on monocytes, CD8, CD4, Treg, B, and NK cells from peripheral blood of untreated RA patients (RA) and healthy controls (C). Representative dot plots for surface expression of CD39 and CD73 and frequencies of different subpopulations (CD39+CD73+, CD39+CD73−, CD39−CD73+, and CD39−CD73−). Data are expressed as means and SD (standard deviation) of the percentage of the corresponding population (CD4+ T cells, CD8+ T cells, B cells, NK, lymphocytes, and monocytes). In the case of Treg (CD4+CD25highCD127low) the percentage is expressed for total CD4+ T cells. An unpaired t-test was used to compare the percentages in the RA and C groups.

