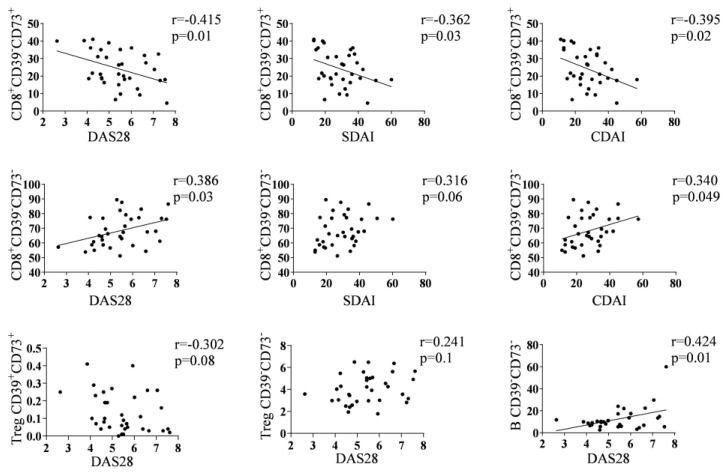
Figure 2.
Correlations between some subsets and clinical parameters. Correlation plots corresponding to relationships between disease activity indexes and the percentages of CD8+CD39−CD73+, CD8+CD39−CD73−, Treg CD39+CD73+, Treg CD39−CD73− or B CD39−CD73− subsets in RA patients at baseline. Only the plots with a tendency line presented a significative correlation applying Pearson’s test.

