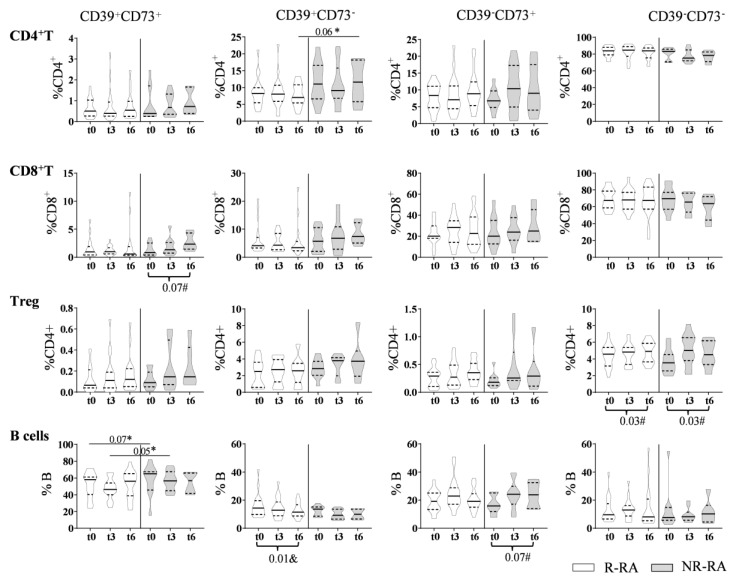
Figure 4.
Evolution of the percentage of subsets on CD4+ T, CD8+ T, Treg and B cells in R-RA (n = 20) and NR-RA (n = 10) patients. The percentage of different subsets at baseline (t0) and after 3 or 6 months of treatment (t3 and t6, respectively) in R-RA (white violins) and NR-RA (grey violins). The p values in the plots correspond to comparisons between equivalent subsets in R and NR-RA applying Student’s t-test (*). We analyzed the changes after treatment in each subset by applying ANOVA for paired samples (#) or the Friedman test (&) (p values indicated at the bottom of the plots).

