FIG. 1.
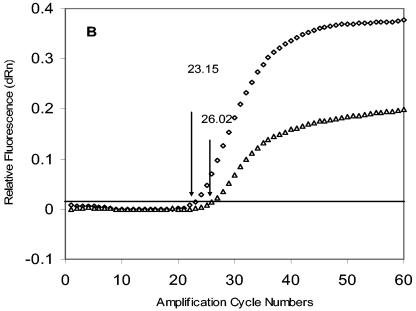
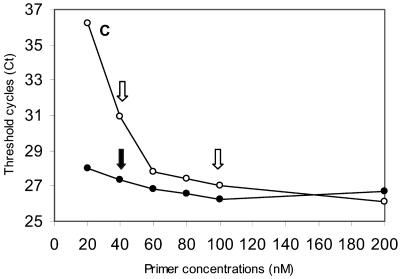
Amplifications of HIV-1 LTR and RNase P DNA with 8E5 cellular DNA. (A) Amplification profiles of HIV-1 LTR. Chromosomal DNA was extracted from cultured 8E5 cells and amplified using an HIV LTR primer and probe set. The HIV forward primer, reverse primer, and probe are 200 nM, 400 nM, and 400 nM, respectively. The horizontal cutoff (threshold) lines are determined by MX4000 software and are 0.054. CT (20.75; one standard deviation, ± 0.25) is the cycle number where the fluorescence output exceeds the threshold. The relative fluorescence (dRn) was the fluorescence output normalized by Rox, which serves as the passive dye in the assay system. (B) Amplification profiles of HIV-1 LTR. The same isolated 8E5 DNA as shown in (A) was amplified with the RNase P primer and probe set. The typical RNase P forward primer, reverse primer, and probe are 200 nM, 200 nM, and 200 nM (diamonds), and the attenuated concentrations are 40 nM, 100 nM, and 200 nM (triangles). The cutoff for RNase P is 0.02. The RNase P CT at the typical concentrations is 23.15 (± 0.03), and that at the attenuated conditions is 26.02 (± 0.29). (C) The effect of the RNase P forward and reverse primer concentrations on RNase P amplification. The experiment was carried out with forward primer (solid circles) or reverse primer (open circles) concentrations varying from 20 to 200 nM, while the concentrations of their pairing primers were kept at 200 nM. The CT value obtained from each set of amplification conditions was plotted against the concentrations of the forward or reverse primer. Solid downward arrow, when the forward RNase P primer concentration was lowered from 200 nM to 40 nM, the RNase P CT increased slightly by 0.6 cycles; left open arrow, when the reverse primer concentration was lowered from 200 nM to 40 nM, the RNase P CT increased markedly by 4.8 cycles; the CT only increased by 0.9 cycles if the reverse primer was adjusted to 100 nM (right open arrow).


