FIG. 2.
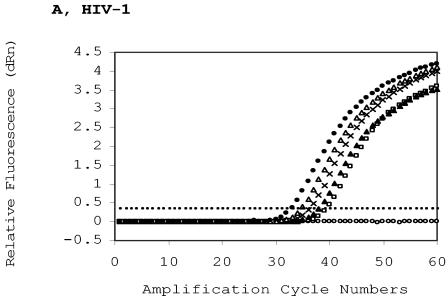
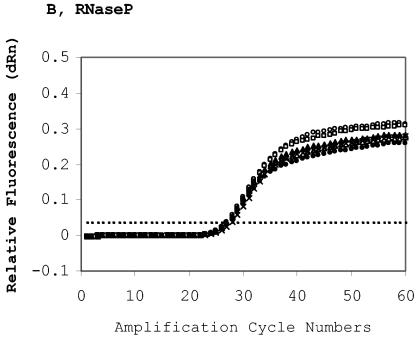
Quantitative measurement of HIV-1 proviral DNA content. 8E5 cells were diluted with the whole blood of a healthy HIV-1-seronegative person and spotted to generate five spots with decreasing HIV-1 DNA contents and a constant whole-blood background. A spot with only the seronegative blood was used as the negative DBS control. Extraction of DBS in quadruplicate was carried out in a single run, and the extracted DNA samples were assayed in a single real-time run to determine the intrarun variability (see also Table 2). DBS DNA was extracted and eluted in 50 μl of water, and 20 μl of the eluted DNA was used in the duplex assay. (A) Real-time HIV-1 amplification profiles. The HIV-1 copy numbers per ml of DBS (50 μl of whole blood per circle) are 0 (open circles), 494 (squares), 1,482 (solid triangles), 4,444 (crosses), 13,333 (open triangles), and 40,000 (solid circles). The threshold (cutoff) is 0.354. (B) Real-time RNase P amplification profiles to determine the human chromosomal DNA background of the same dried blood spots as in (A). The threshold is 0.034. (C) HIV-1 content quantification in DBS panel based on threshold cycles (CTs) or normalized threshold cycles (dCTs). The CTs (HIV LTR [diamonds] and RNase P [squares]) were plotted against their respective proviral copy numbers. Each datum was derived from the average of four determinations. Vertical bar: one standard deviation of CT or dCT. The dCT (triangle) is the difference between the HIV CT and its corresponding RNase P CT.


