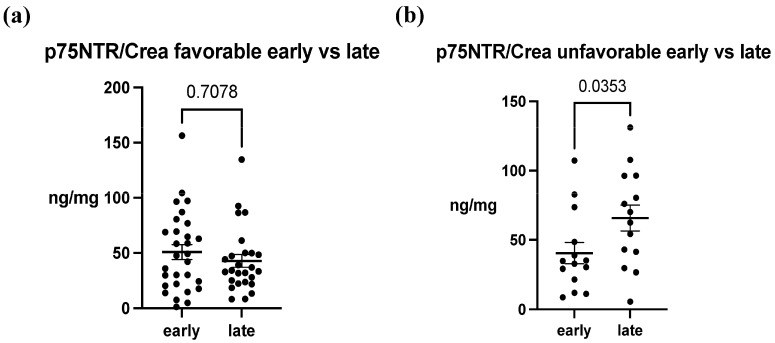
Figure 3.
The change in p75NTR/Crea concentration ratio over time. (a) In the favorable outcome group, temporal difference in p75NTR/Crea was not observed (p = 0.708). (b) In the unfavorable group, p75NTR/Crea level was significantly increased in late samples (p = 0.0353). The data represent mean ± SEM (p75NTR/Crea, ng/mg). Each data point within a set corresponds to a single study patient.

