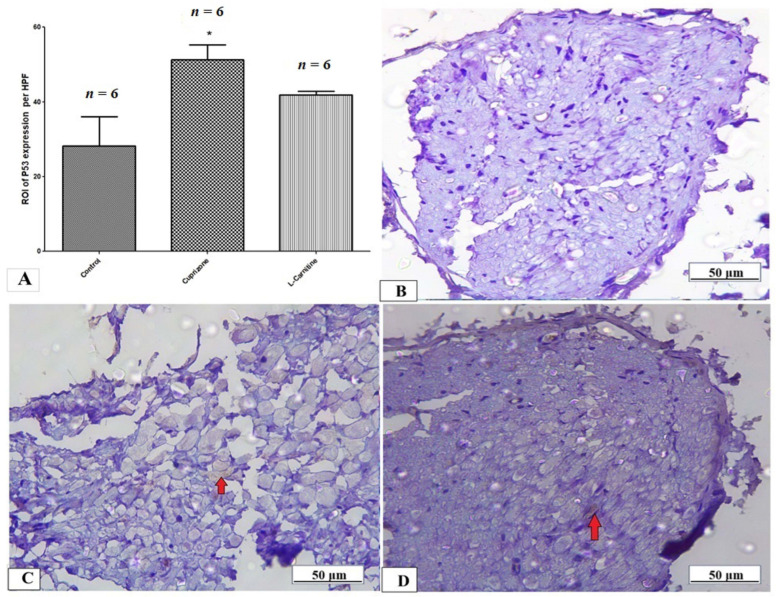
Figure 9.
Immunohistopathological staining for p53 in sciatic nerves. (A) The score of p53 expression in the region of interest (ROI) in different studied groups. Photomicrographs of p53 from control group (B), Cuprizone group (C), and Cup + LC group (D). *: Significant vs. control group. p < 0.05 is considered significant.

