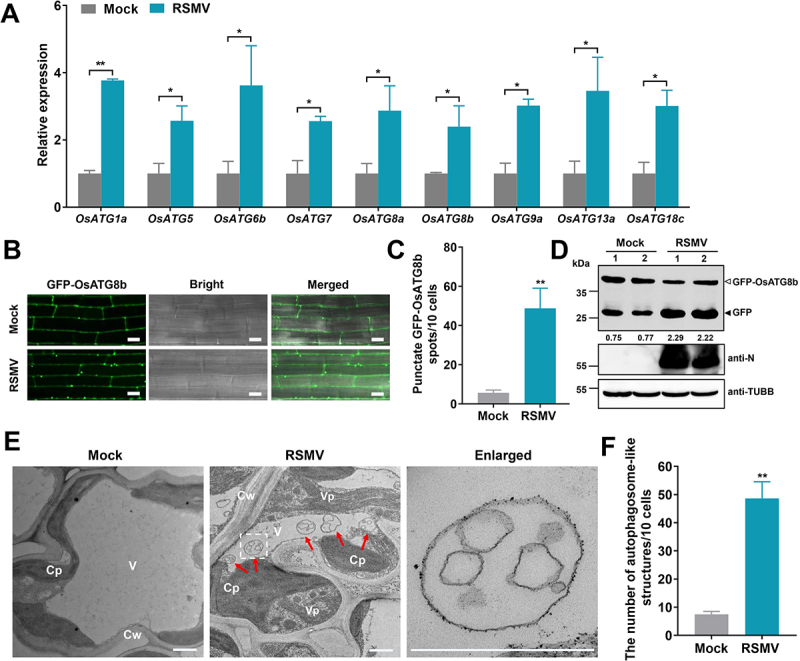
Figure 1.

RSMV infection activates autophagy in rice plants. (A) Effects of RSMV infection on the expression of autophagy components in WT plants. Total RNAs were extracted from mock-infected or RSMV-infected rice leaves at 30 dpi. Values represent the mean relative to the mock-treated plants (n = 3 biological replicates) and were normalized with OsEf1α as an internal reference. Student’s t test was used for analyses (*P<.05). (B) relative autophagic activity revealed by GFP-OsATG8b transgenic rice plants infected by RSMV at 30 dpi. Autophagic bodies are revealed as GFP-positive puncta in the root cells. Bars: 10 μm. (C) the average number of GFP-OsATG8b spots in different samples in (B). Experiments were repeated six times and 60 cells in total were counted for the puncta in each treatment. Values represent the mean spots ± SD per 10 cells. Student’s t test was used for analyses (**P<.01). (D) accumulation of free GFP released from GFP-OsATG8b reporter upon RSMV infection. GFP-OsATG8b transgenic rice plants were RSMV-infected or mock-infected, and rice leaves were extracted at 30 dpi and then subjected to immunoblot analysis. The closed arrowhead indicates free GFP, and the open arrowhead indicates GFP-OsATG8b. The numbers below the bands represent the intensity ratio of free GFP verse GFP-OsATG8b. (E) Representative TEM images from the leaves of rice plants infected with mock or RSMV at 30 dpi. Obvious autophagic structures (red arrows) were observed in RSMV-infected samples and the corresponding region in the white box in the middle panel is magnified in the right panel. Cw cell wall, Cp chloroplast, V vacuole, Vp viroplasm. Bars: 1 μm. (F) the average number of typical double-membrane autophagosomes in different samples in (E). Experiments were repeated six times and 60 cells in total were counted for typical autophagic structures in each treatment. Values represent the mean number of autophagosomes ± SD per 10 cells. Student’s t test was used for analyses (**P<.01).
