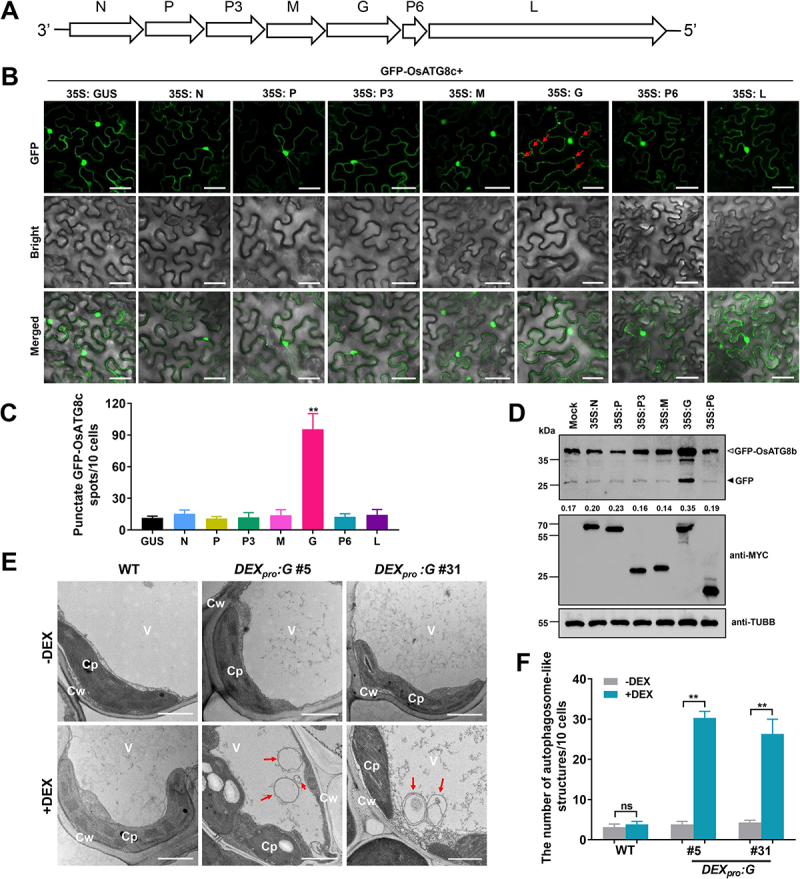
Figure 2.

RSMV encoded glycoprotein induced autophagy in plant cells. (A) Schematic representation of the RSMV anti-genome and its encoded proteins. (B) relative autophagic activity revealed by GFP-OsATG8c in N. benthamiana leaves expressing different RSMV encoded proteins. Autophagic bodies are revealed as GFP-positive puncta in the epidermal cells and are indicated by red arrows. Each RSMV encoded proteins were driven by 35S promoter and GUS was used as a negative control. N nucleocapsid protein, P phosphoprotein, M matrix protein, G glycoprotein, L large polymerase protein. Bars: 50 μm. (C) the average number of GFP-OsATG8c spots in different samples in (B). Experiments were repeated six times and 60 cells in total were counted for the puncta in each treatment. Values represent the mean spots ± SD per 10 cells. One-way ANOVA followed by multiple-comparisons Tukey’s test was used for analyses (*P<.01). (D) accumulation of free GFP released from GFP-OsATG8b reporter upon RSMV proteins expression. Protoplasts generated from GFP-OsATG8b transgenic plants were transfected with plasmids expressing MYC tag-fused RSMV proteins, total protein was extracted after 12 h and then subjected to immunoblot analysis. The closed arrowhead indicates free GFP, and the open arrowhead indicates GFP-OsATG8b. The numbers below the bands represent the intensity ratio of free GFP verse GFP-OsATG8b. (E) Representative TEM images from the leaves of WT and DEXpro:G transgenic rice plants treated with or without DEX. Obvious autophagic structures (red arrows) were observed in the samples of DEX-treated DEXpro:G plants. Cw cell wall, Cp chloroplast, V vacuole. Bars: 1 μm. (F) the number of typical double-membrane autophagosomes in different samples in (E). Experiments were repeated six times and 60 cells in total were counted for typical autophagic structures in each treatment. Values represent the mean number of autophagosomes ± SD per 10 cells. Two-way ANOVA followed by multiple-comparisons Tukey’s test was used for analyses (**P<.01).
