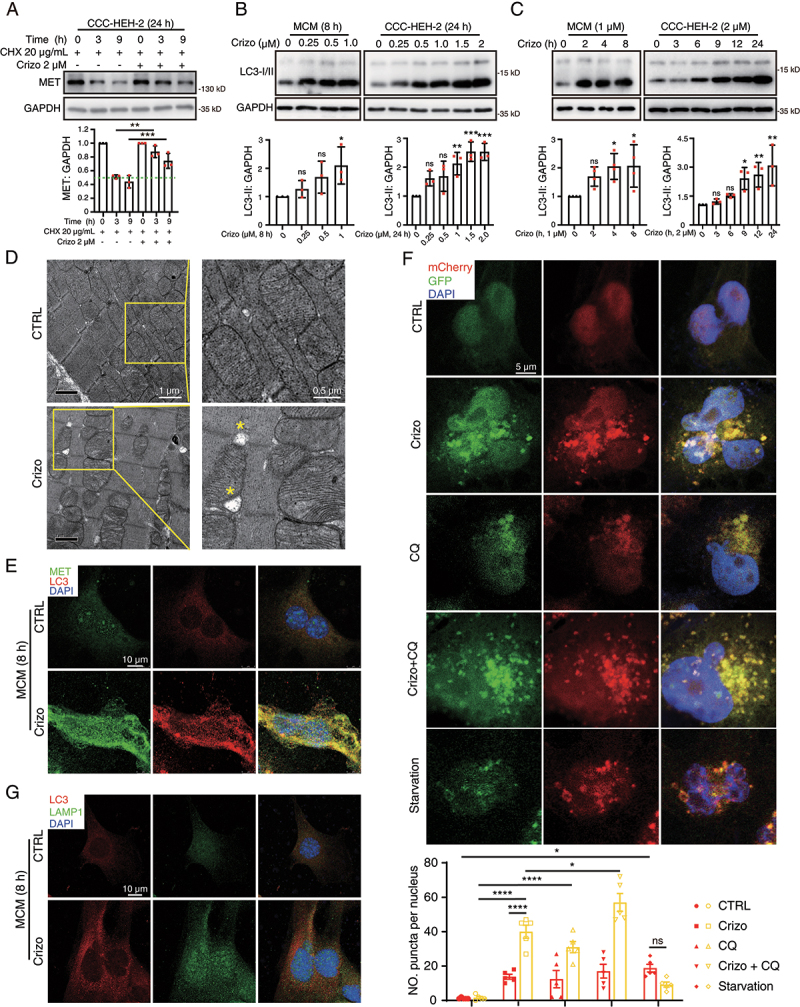
Figure 4.

Crizotinib inhibits autophagosome-lysosome fusion in cardiomyocytes. (A) CCC-HEH-2 cells were treated with CHX (20 μg/mL) with or without crizotinib. Representative images (upper) and relative quantification (lower) were shown. GAPDH was used as a loading control. n = 3. (B, C) MCMs and CCC-HEH-2 cells were treated with crizotinib as indicated. Representative images (upper) and relative quantification (lower) were shown. GAPDH was used as a loading control. n = 3, 4. (D) TEM observation of the cardiac ventricles from mice treated with crizotinib and representative images were shown. Scale bar: 1 μm, 0.5 μm. (E) the co-localization of LC3 with MET in untreated or crizotinib-treated MCMs. The cells were stained for LC3 (red), MET (green) and DAPI (blue). Cells were treated with crizotinib for 8 h. Scale bar: 10 μm. (F) MCMs were infected with the mCherry-GFP-LC3 virus. 12 h after infection, cells were treated with crizotinib (2 μM), CQ (10 μM) and CQ plus crizotinib for 8 h or serum starvation stress for 2 h, respectively. Autophagic flux assays were performed with the confocal microscope. Scale bar: 5 μm. Quantification of the number of mCherry and GFP fluorescent puncta was beneath the images. n = 10 fields from more than three independent experiments per group. (G) the cells were treated with crizotinib for 8 h cells and then were stained for LC3 (red), LAMP1 (green) and DAPI (blue). Scale bar: 10 μm. Data were presented as mean ± SD. The P value was calculated by one-way ANOVA with Dunnett’s (B and C), Tukey’s (A and E) multiple comparisons tests or unpaired Student’s t test (F, within a group). ****, P < 0.0001; ***, P < 0.001; **, P < 0.01; *, P < 0.05; ns, no significance. CTRL: control; Crizo: crizotinib; LAMP1: lysosomal-associated membrane protein 1.
