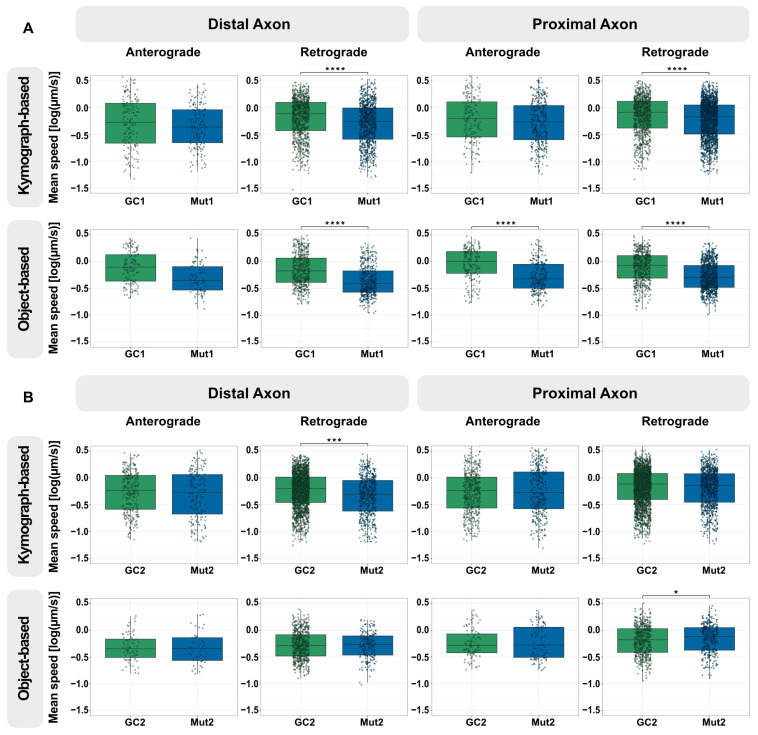
Figure 2.
LRRK2 G2019S reduces the speed of retrograde lysosomal trafficking in neurons from one NPC line with mutant LRRK2 but not as much in those from the second. (A) Quantification of the mean speed of anterograde and retrograde lysosomes in the distal and proximal axons of GC1 and Mut1 neurons using kymograph-based analysis (top) and object-based analysis (bottom). (B) Quantification of the mean speed of anterograde and retrograde lysosomes in the distal and proximal axons of GC2 and Mut2 neurons using kymograph-based analysis (top) and object-based analysis (bottom). For all graphs: Pooled individual measurements from N = at least six independent experimental replicates. Statistics were calculated using a 2-way ANOVA with the post-hoc Tukey’s test to compare GC and Mut, considering any variation between the experimental replicates. **** corresponds to p-adj ≤ 0.0001, *** to p-adj ≤ 0.001, and * to p-adj ≤ 0.05. Comparisons without a marked * did not show any significant differences. The exact mean differences and p-values can be found in Table S1. Graphical representations of individual experimental replicates can be found in Figures S4 and S5.

