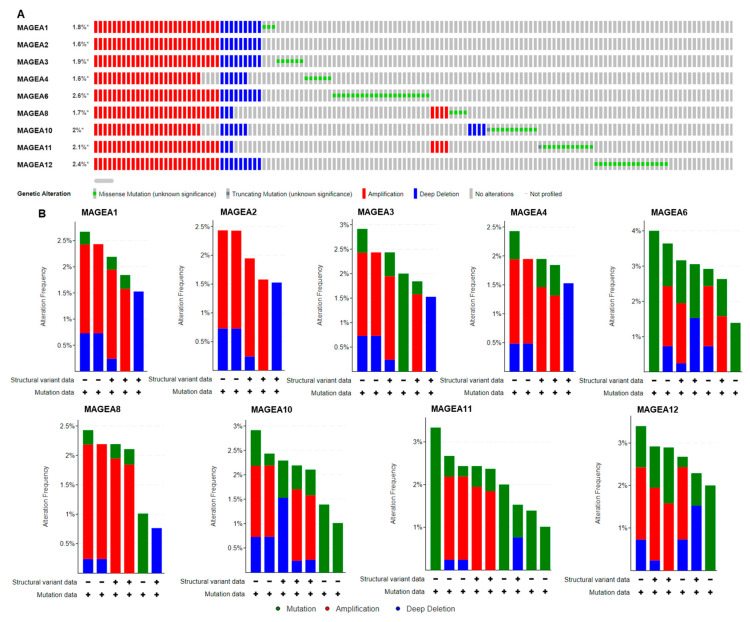
Figure 3.
Genomic alterations in MAGEA family members. Oncoprint of MAGEA1, MAGEA2, MAGEA3, MAGEA4, MAGEA6, MAGEA8, MAGEA10, MAGEA11, and MAGEA12 in bladder cancer patients (n = 5436). (A) Color bar represents the individual patient’s profile showing gene amplification in red, * denotes % gene amplification; deletion in blue; and mutation in green. (B) Bar graph represents the summary of MAGEA gene alteration frequency (Y-axis), and the X-axis shows the mutation rate (green), amplification (red), and deep deletion (blue) in bladder cancer patients.

