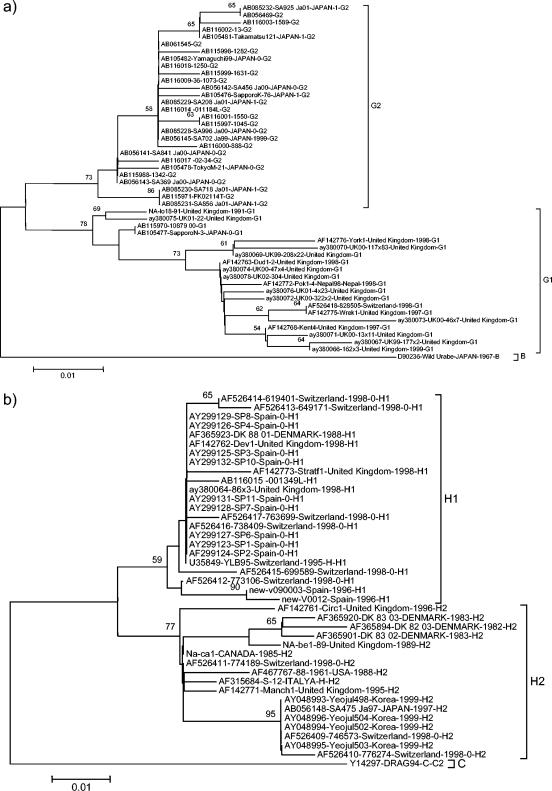
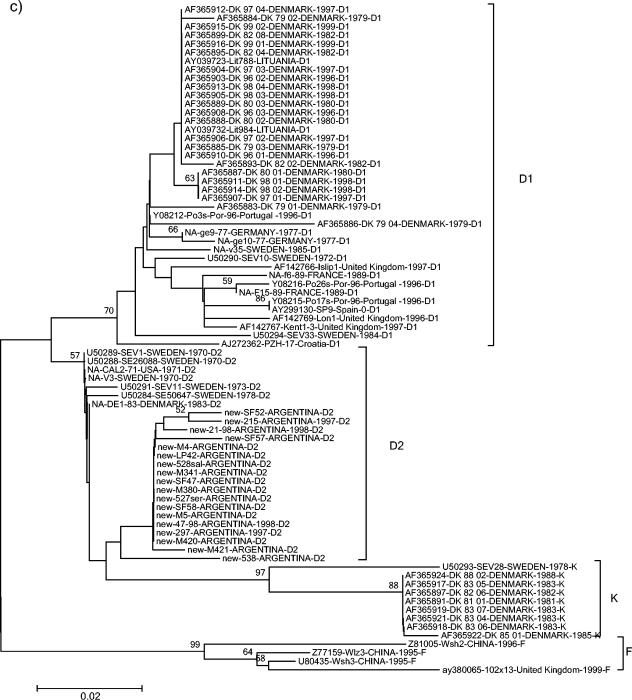
FIG. 2.
(a) Phylogenetic tree of a genotype G strain; genotype B sequences were included as the outgroup. (b) Phylogenetic tree of genotype H strains; genotype C sequences were included as the outgroup. (c) Phylogenetic tree of genotype D and K strains, genotype F sequences were included as the outgroup. All available sequences of the corresponding genotype were included in the trees. The analysis method was the same as that reported for Fig. 1.


