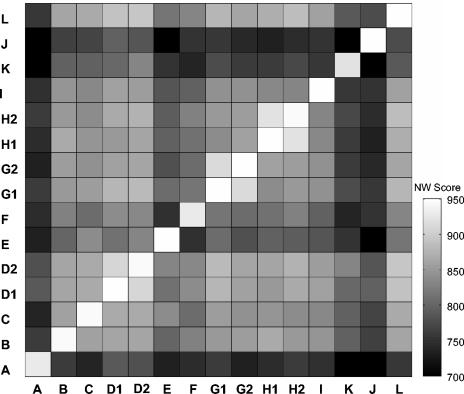
FIG. 3.
Pairwise analysis of all available sequences of mumps virus SH against themselves is represented in the graph. Pairwise nucleotide alignment between all members of the database was done. The average score between members of each genotype is plotted in the graph. The different colors represent the Needleman Wunch scores obtained for each genotype comparison.

