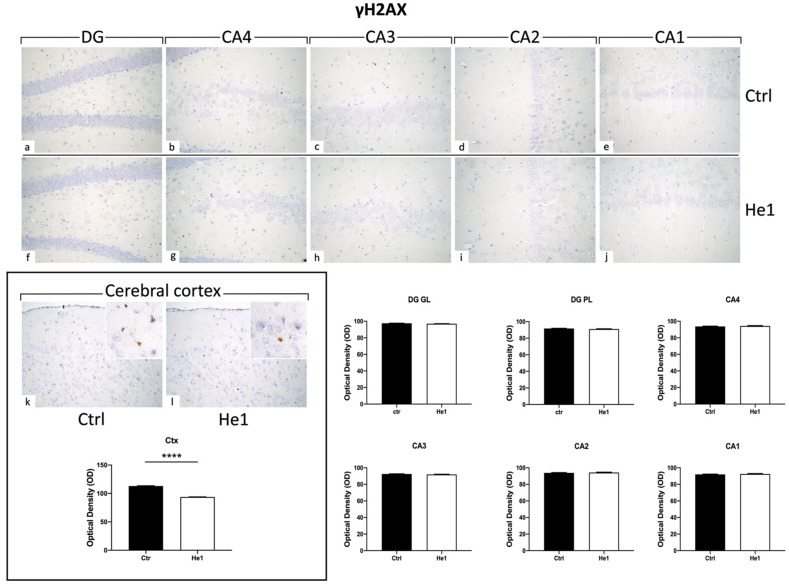
Figure 9.
Representative micrographs depicting immunohistochemical reaction for γH2AX in hippocampal DG and CA subfields and in cerebral cortex from controls (a–e,k) and He1-treated mice (f–j,l). Magnification: 40× (a–l); 100× (insert in k,l). Histograms illustrating γH2AX-immunopositive cell OD assessed in hippocampal DG and CA subregions and in cerebral cortex of control and He1-supplemented mice. p-values calculated by unpaired Student’s t-test. **** p < 0.0001.

