Figure 2.
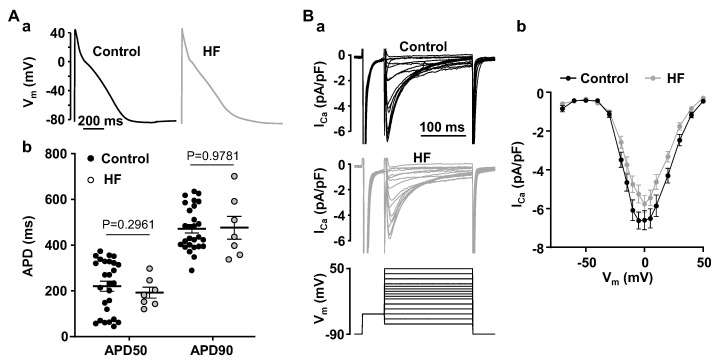
AP morphology and ICa in normal and HF atrial myocytes. (A): (a) Atrial APs recorded in normal and HF current clamped myocytes at 1 Hz. (b) Mean ± SEM and individual AP durations at 50% and 90% of repolarization in control (N/n = 23/28) and HF (N/n = 5/7) myocytes recorded at 1 Hz pacing. Statistical analysis performed using Welch t-test. (B): (a) Representative ICa traces in normal and HF atrial myocytes recorded during step stimulation protocol (bottom). (b) I-V curves of ICa recorded in normal (N/n = 4/10) and HF (N/n = 7/16) atrial myocytes. No statistical differences between ICa amplitude in control and HF myocytes (Šidàk’s test).

