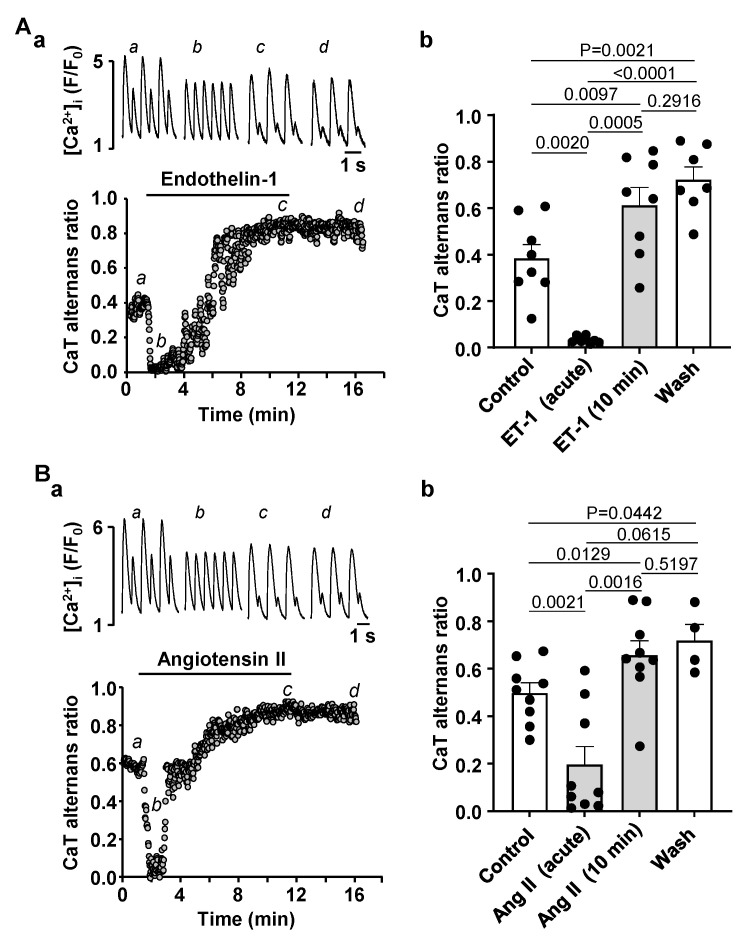
Figure 4.
Stimulation of IP3 signaling by ET-1 and Ang II has a dual effect on CaT alternans. (A): (a) CaT ARs recorded over time in control and in the presence of 100 nM ET-1. Top: CaT traces observed at the times marked by the corresponding letter in the bottom graph. (b) Mean ± SEM and individual CaT ARs observed in control, after 0.5–2 min of application of ET-1 at the point of maximal effect of ET-1 (acute effect), after 10 min of ET-1 application and following ≥5 min washout of ET-1 (N/n = 3/8; Tukey’s test). (B): (a) CaT ARs recorded over time in control and in the presence of 500 nM Ang II. Top: CaT traces observed at the times marked by the corresponding letter in the bottom graph. (b) Mean ± SEM and individual CaT ARs observed in control, after acute application of 500 nM of Ang II, after 10 min of Ang II application and after ≥5 min washout (N/n = 4/9 Tukey’s test).

