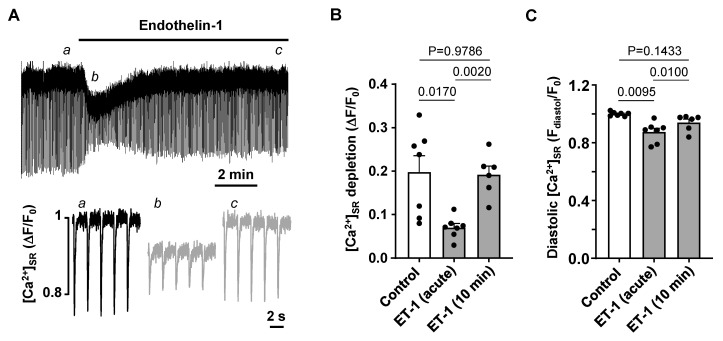
Figure 6.
Effect of endothelin-1 on SR Ca2+ load. (A) [Ca2+]SR measured with the low affinity Ca2+ indicator Cal520N in control and in 100 nM ET-1 in cells paced at 0.5 Hz. Bottom: depletions of [Ca2+]SR recorded at times indicated by the corresponding letter in the top graph. (B,C): Mean ± SEM and individual depletions of [Ca2+]SR (B) and diastolic [Ca2+]SR (C) measured in control, during transient ET-1 effect and after 10 min application of ET-1 (N/n = 2/7). Statistics: Tukey’s test.

