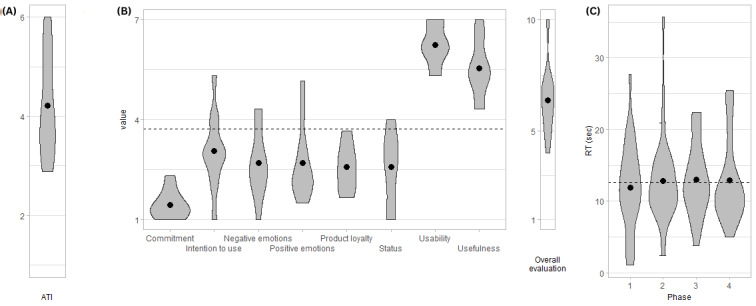
Figure 1.

Violin plots of (A) Affinity for Technology Interaction (ATI; min=1, max=6), (B) score values across the constructs of modular evaluation of key Components of User Experience (meCUE; min=1, max=7, except for overall evaluation, which is min=1, max=10), and (C) reaction time across phases in study 0 (n=11). The dots represent the group mean; the dashed line represents the overall mean. RT: reaction time; sec: seconds.
