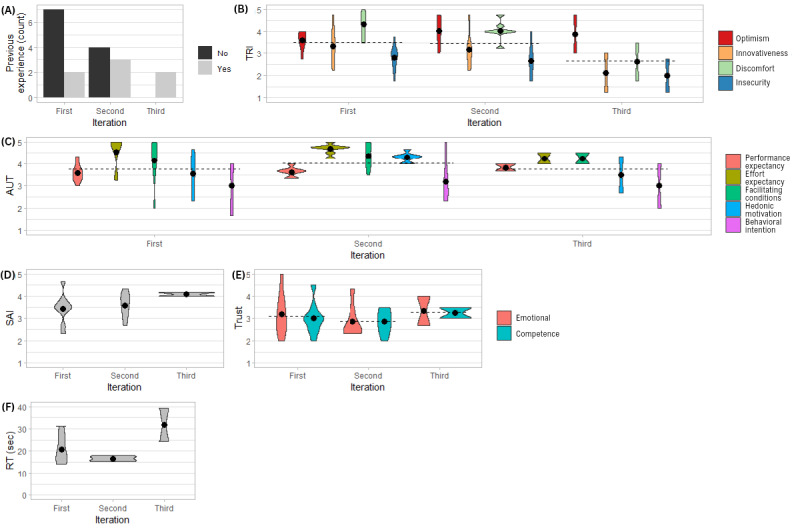
Figure 2.

Violin plots of (A) count of previous experience, (B) score values across the constructs of Technology Readiness Index (TRI; min=1, max=5), (C) score values across the constructs of Acceptance and Use of Technology (AUT; min=1, max=5), (D) Session Alliance Inventory (SAI) scores (min=1, max=5), (E) Trust scores (min=1, max=5), and (F) reaction time across iterations in study 1 (n=18). The dots represent the group means; the dashed line represents the overall mean within an iteration. RT: reaction time; sec: seconds.
