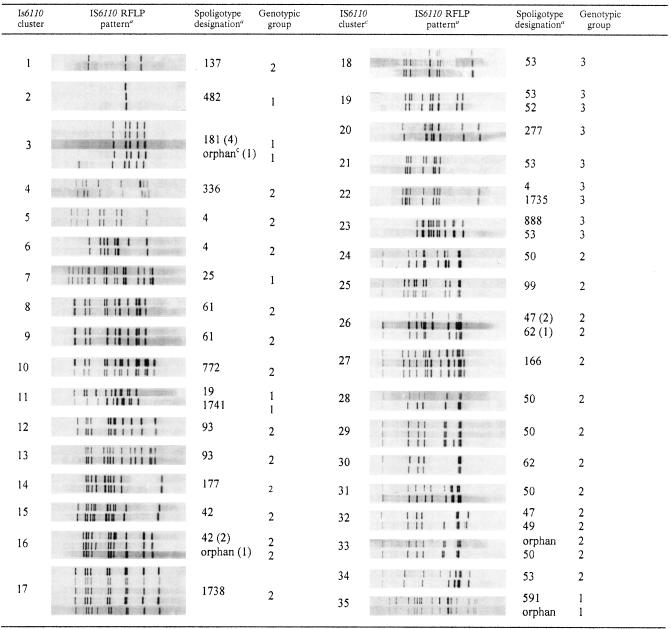
TABLE 3.
Spoligotypes and katG and gyrA polymorphisms of isolates in IS6110 clusters
Each panel shows the IS6110 banding patterns of the isolates included in the cluster.
See Table 2, footnote a. When an IS6110 cluster included different spoligotypes, the number of isolates with a given spoligotype or orphan isolates is given in parentheses.
“Orphan” indicates a spoligotype not matching any existing pattern in the database.

