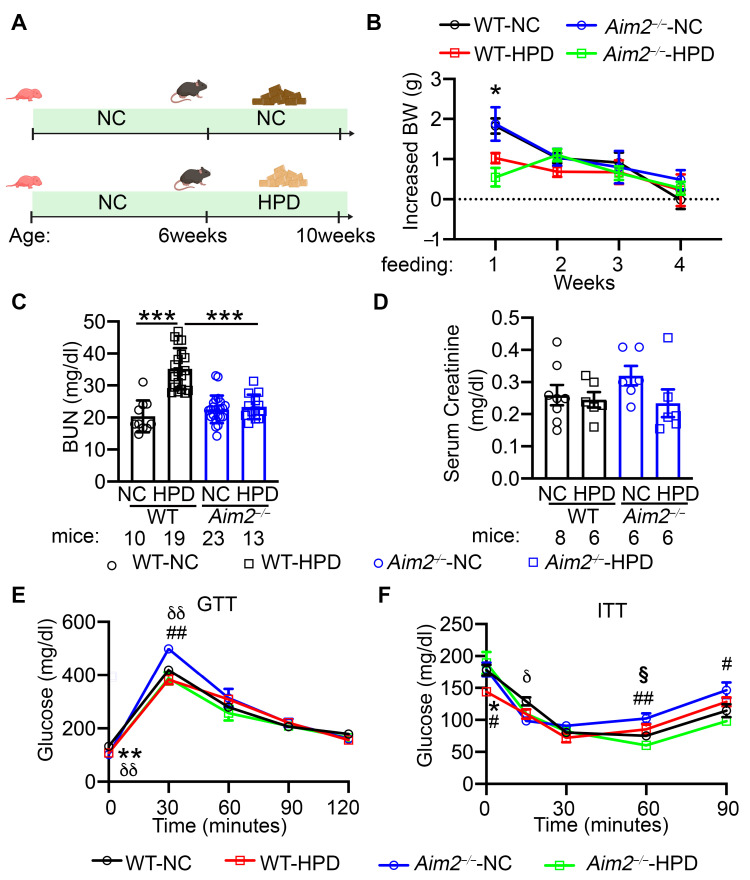
Figure 1.
High-protein diet (HPD) displayed salutary effects on body weight and glucose tolerance. (A) Group design of WT and Aim2−/− mice received normal chow (NC) or HPD, respectively. Created with BioRender.com. (B) Weekly body weight (BW) gain. N = 8 mice/group. (C) Blood urea nitrogen level (BUN) levels. (D) Serum creatinine levels. (E,F) Plasma level of glucose during glucose-tolerance test (GTT, E) and insulin-tolerance test (ITT, F) in WT and Aim2−/−-mice after 4 weeks of feeding with NC or HPD, respectively. In (B,C), * p < 0.05, *** p < 0.001. In (E,F), * p < 0.05, ** p < 0.01, WT-NC vs. WT-HPD; δ p < 0.05, δδ p < 0.01, WT-NC vs. Aim2−/− -NC; # p < 0.05, ## p < 0.01, Aim2−/−-NC vs. Aim2−/−-HPD; § p < 0.05, WT-HPD vs. Aim2−/−-HPD. p-values were determined by Welch ANOVA and Dunnett’s T3 multiple comparisons test in (B,C,E), and Welch ANOVA and Dunnett’s T3 multiple comparisons test and Kruskal–Wallis with Dunn’s multiple comparisons test in (F).

