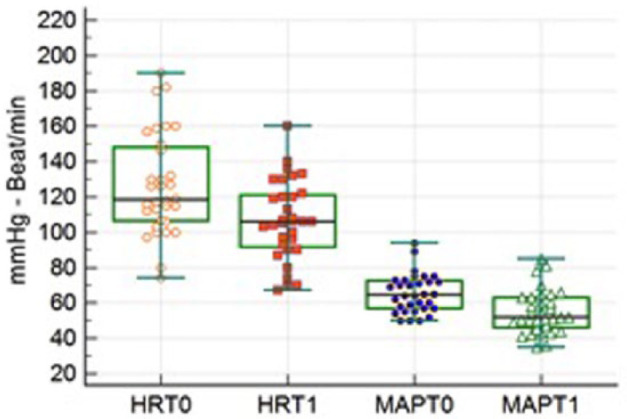
Figure 2.

Box plot of mean arterial pressure (MAP) and heart rate (HR) before (T0) and 10 mins after (T1) intrathecal injection. HR and MAP decreased after intrathecal anaesthesia (P = 0.005 and P = 0.003, respectively); dots refer to the value of individual cases. The whiskers show the range values, the width of the box shows the interquartile range and the bar in the box is median value
