
Figure 1.
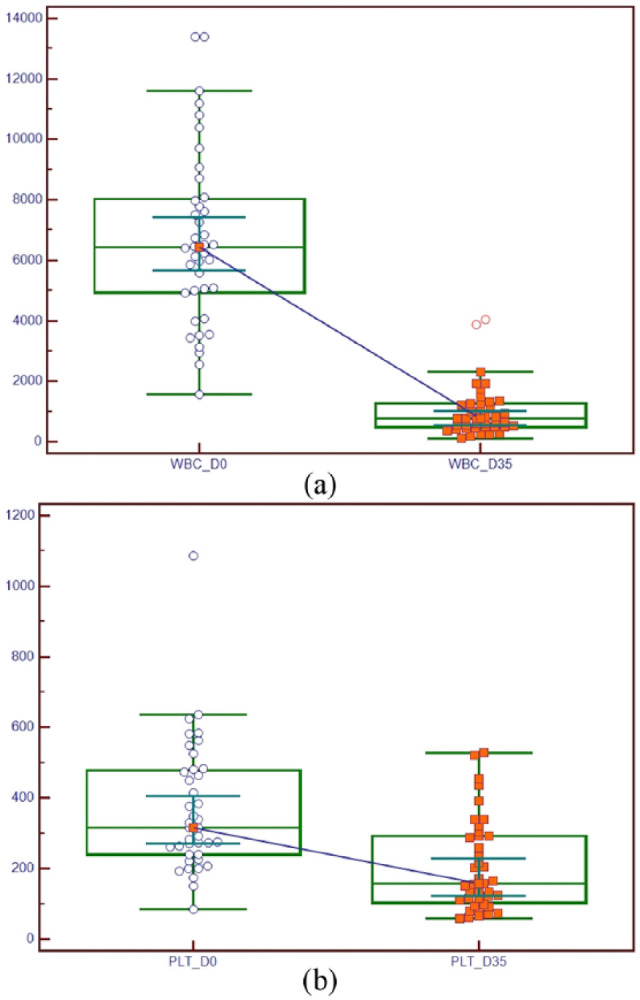
Graph displaying the statistically significant (P <0.0001, Wilcoxon test) decrease in (a) white blood cells (WBCs) and (b) platelets (PLTs) between counts at D0 (date of blood collection) and D35 (date of final storage/expiration of the feline whole blood units) in 40 feline whole blood units collected and stored for transfusion purposes. Values were expressed as unit/µl for WBCs and unit × 103/µl for PLTs. The central box represents the values from the lower to upper quartile (25–75 percentile). The middle line represents the median. A line extends from the minimum to the maximum value, excluding ‘outside’ and ‘outlying’ values, which are displayed as separate points