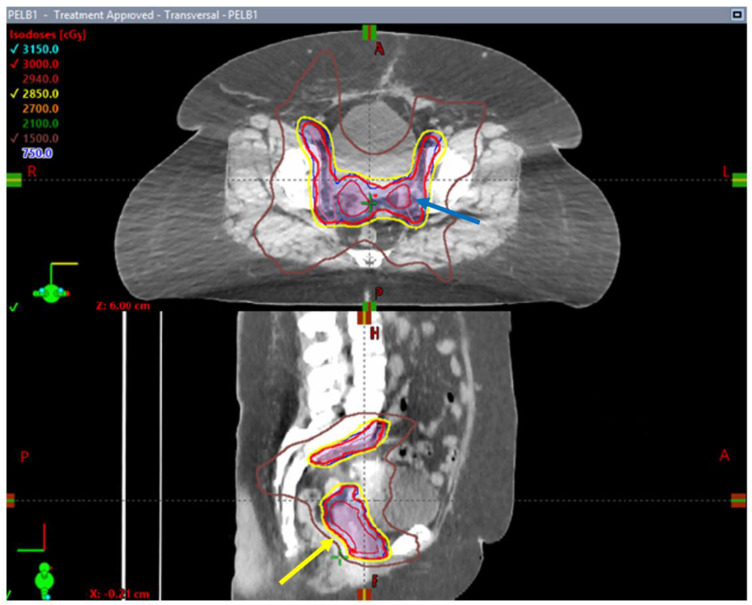
Figure 3.
Axial and sagittal images of an SBRT treatment plan delivered to a patient enrolled in the SPARTACUS clinical trial. Note the conformality of the 95% prescription isodose line (yellow arrow) outlined in yellow around PTV volumes (in dark blue) and the homogenous dose distribution within treated volumes with absence of pockets of 105% isodose lines (blue arrow).

