
Figure 2.
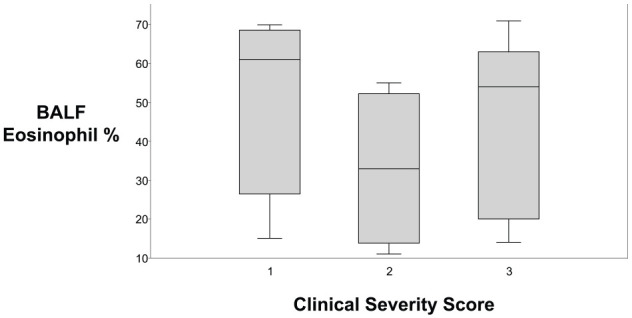
Eighteen cats with a clinical diagnosis of asthma were evaluated using a clinical severity score and percentage of bronchoalveolar lavage fluid (BALF) eosinophils, with data shown in box and whisker plots. There was no correlation between the severity of clinical signs and severity of airway eosinophilia (P = 0.941). The upper and lower boxes represent the 25th and 75th percentiles, respectively. The line represents the median and the upper and lower whiskers represent the maximum and minimum values, respectively