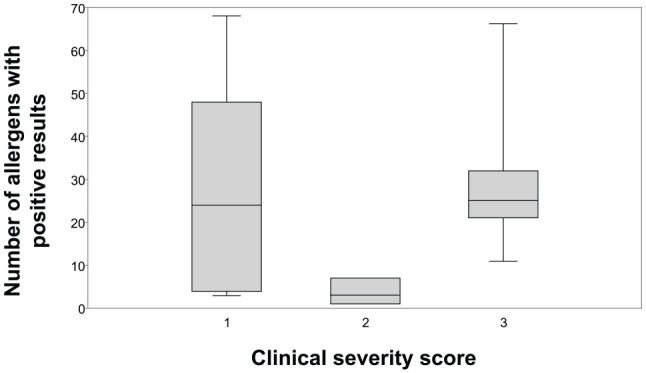
Figure 3.

For the 18 asthmatic cats included in the study, the clinical severity score and number of allergens (out of 83 total allergens) with positive responses were compared using box and whisker plots. The whiskers extend to the highest and lowest observations and the ends of the boxes are the upper and lower quartiles. The median is marked by the line inside the box. There was no significant difference between the clinical severity score when compared with the total number of allergen IgE reactivity (P = 0.675)
