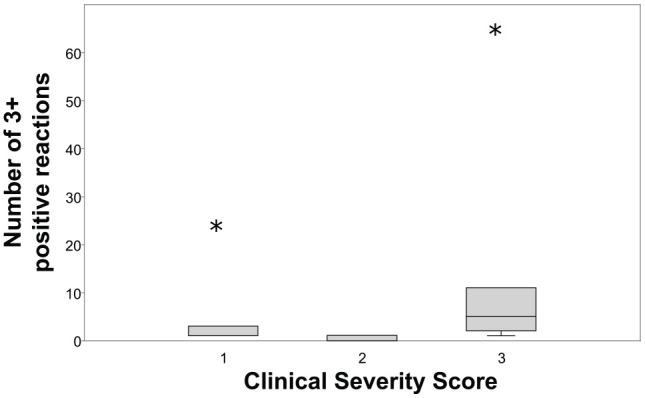
Figure 4.

Box and whisker plot evaluating the number of allergens with 3+ positive results and the clinical severity score of asthmatic cats. When present, the whiskers extend to the highest and lowest observation and the ends of the boxes are the upper and lower quartiles. The median is marked by the line inside the box. Extreme outliers are denoted by the asterisks. There was no significant difference in clinical severity score depending on the number of 3+ positive reactions (P = 0.270)
