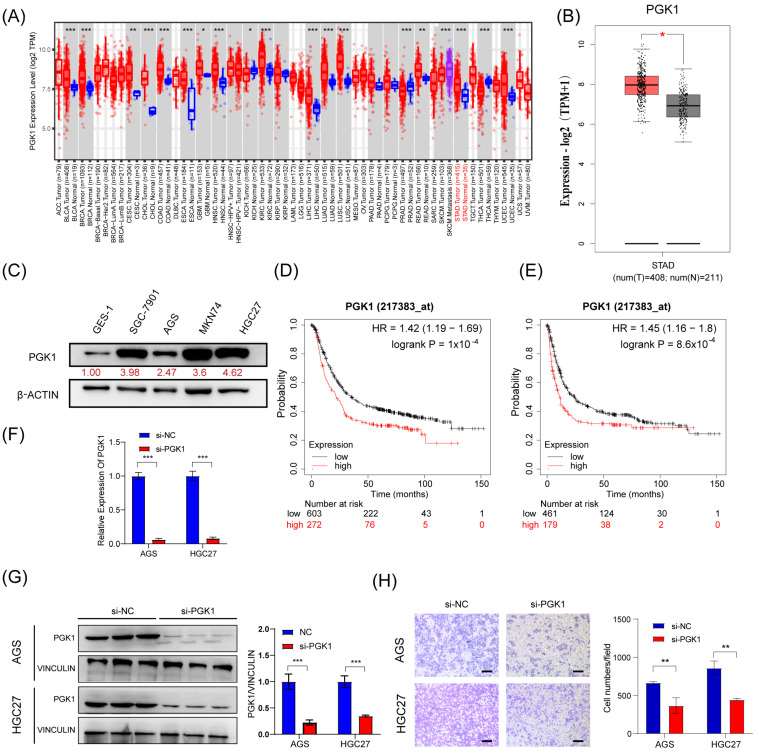
Figure 5.
PGK1 promotes the migratory abilities of GC in vitro. (A,B) Expression level of PGK1 in cancers was analyzed using TIMER 2.0 (A) and GEPIA (B). The red asterisk indicated a significant difference between the two sets of data. (C) The protein levels of PGK1 in normal gastric mucosa epithelial cells and 4 gastric cancer cell lines were detected via Western blot. (D,E) Overall survival analysis (D) and first progression survival analysis (E) of GC patients by the Kaplan–Meier plotter online resource (http://kmplot.com/analysis/). The plot was generated according to the PGK1 expression level. (F,G) The expression of PGK1 mRNA and protein level in AGS and HGC27 cells treated with PGK1 knockdown by siRNAs. (H) Transwell assays were used to detect the migration abilities after the knockdown of PGK1 in AGS and HGC27 cells. Scale bar, 100 μm. The uncropped blots are shown in File S1. All experiments were performed at least three times. Bars represent means ± SD. *, p < 0.05; **, p < 0.01; ***, p< 0.001.

