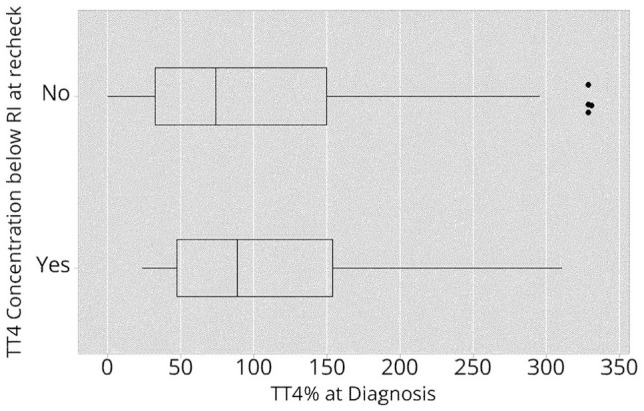
Figure 2.

Distribution of total thyroxine (TT4) concentrations at diagnosis expressed as a percentage above the upper limit of the reference interval (TT4%) in cats with or without a TT4 concentration below the lower limit of the reference interval (RI) at recheck. Data are shown as a box plot. The horizontal line depicts the range. The box and vertical line show interquartile range and median, respectively. The asterisks represent outliers
