
Figure 4.
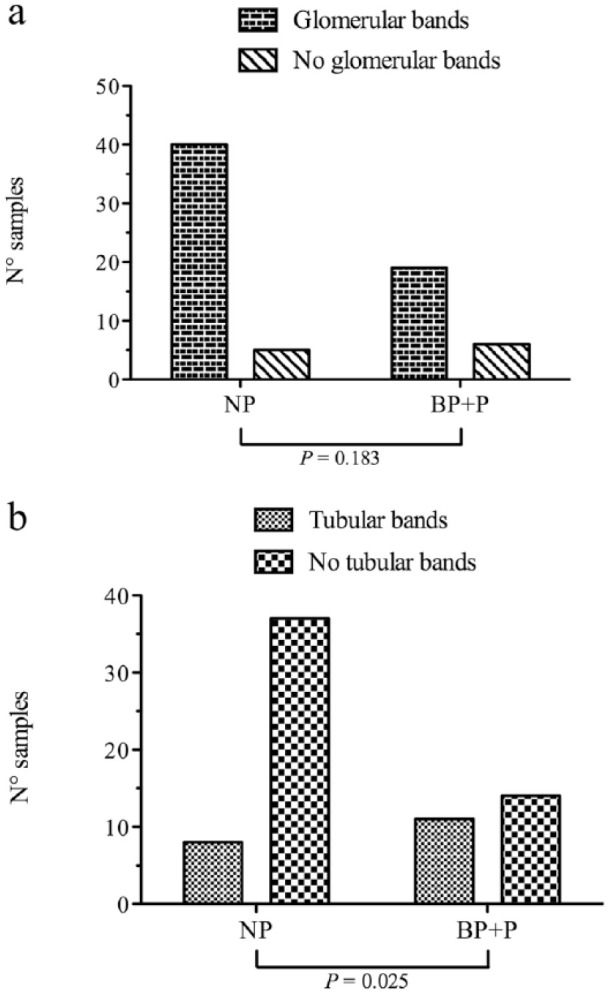
Distribution of (a) samples with or without glomerular bands and (b) samples with or without tubular bands in non-proteinuric (NP) cats (urinary protein:creatinine [UPC] ratio <0.2) and cats with UPC ⩾0.2 (BP + P) (borderline proteinuric [BP] + proteinuric [P])