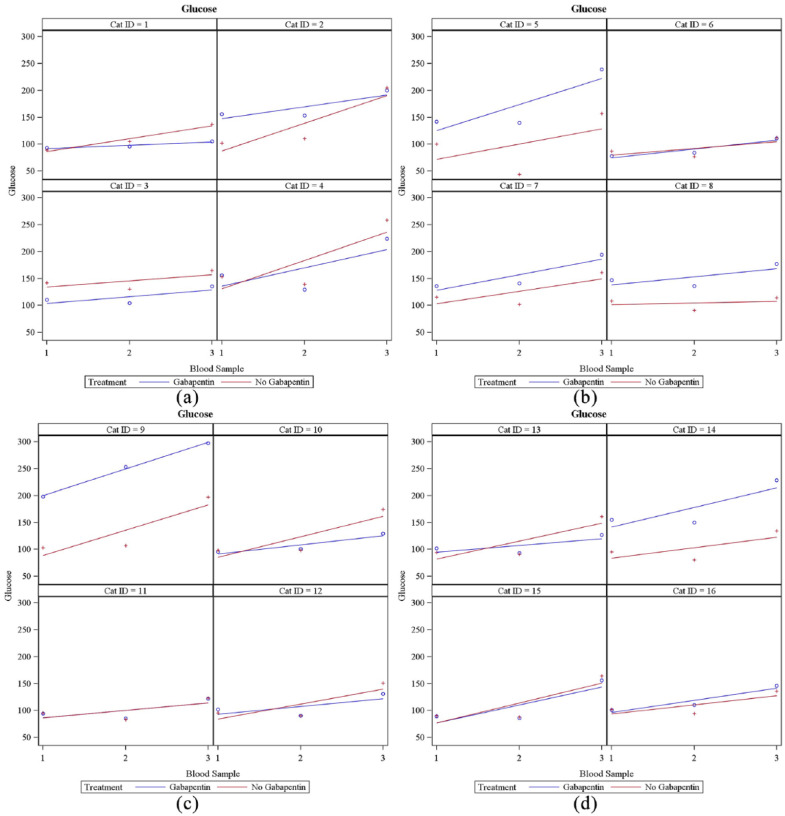
Figure 4.
Results of each cat’s serum glucose concentrations at each visit. (a) Cats 1–4; (b) cats 5–8; (c) cats 9–12; (d) cats 13–16. y-axis = serum glucose concentration (mg/dl); x-axis = blood sample. The blue ○ corresponds to glucose concentrations at blood samples 1, 2 and 3 when gabapentin was administered. The red + corresponds to glucose concentrations at blood samples 1, 2 and 3 when gabapentin was not administered. The line indicates linear regression

