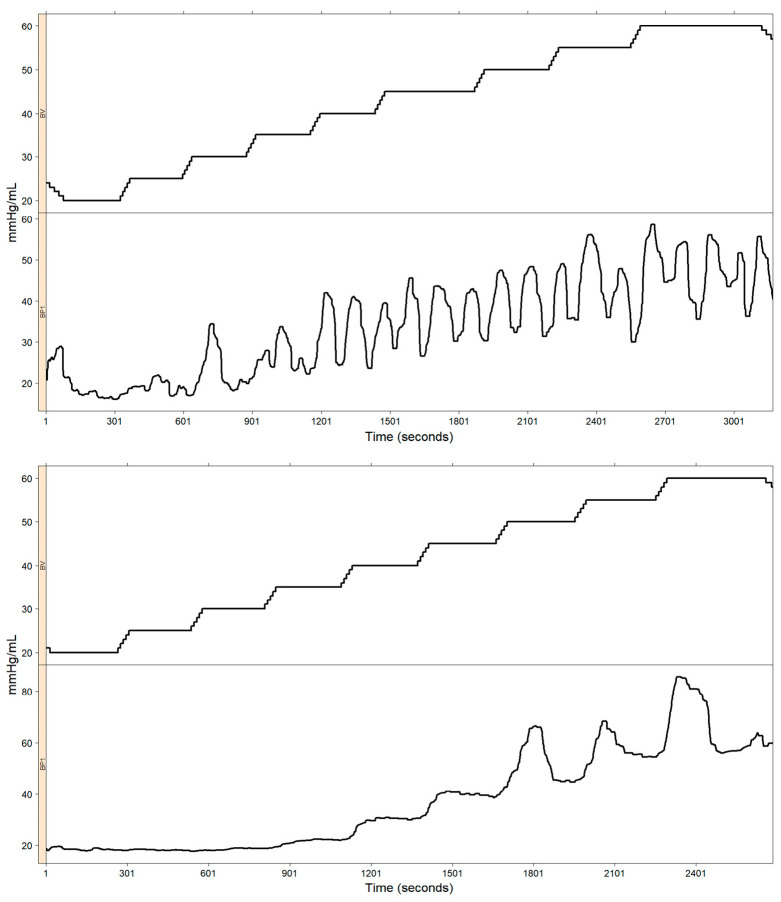
Figure 3.
Volume–pressure relationship. The upper panel shows an approximately monotonic relationship between the volume balloon and the intra-balloon pressure throughout the study. The lower panel shows a “failed” monotonic relationship between volume and pressure. Only in the last part of the study, from time = 1201 s on, there existed an approximately monotonic relationship between volume and pressure.

