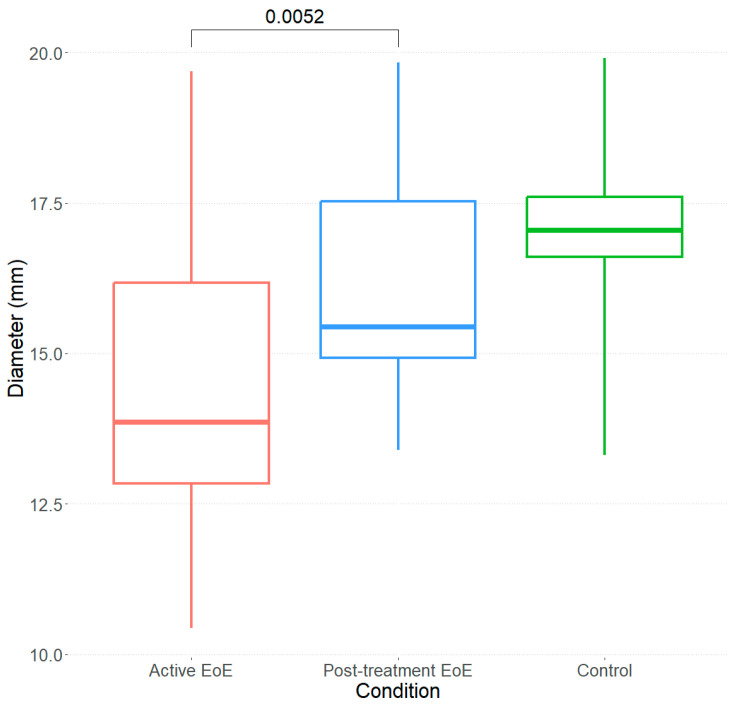
Figure 5.
Boxplots of D (60 mL) for the three analyzed cases. The red boxplot corresponds to the 14 EoE patients at baseline with a mean diameter of 14.51 ± 2.68 mm. The blue boxplot corresponds to the 14 patients after the treatment with a mean diameter of 16.22 ± 1.86 mm. The green boxplot corresponds to the cases of ten control subjects with a mean diameter of 17.08 ± 1.69 mm.

