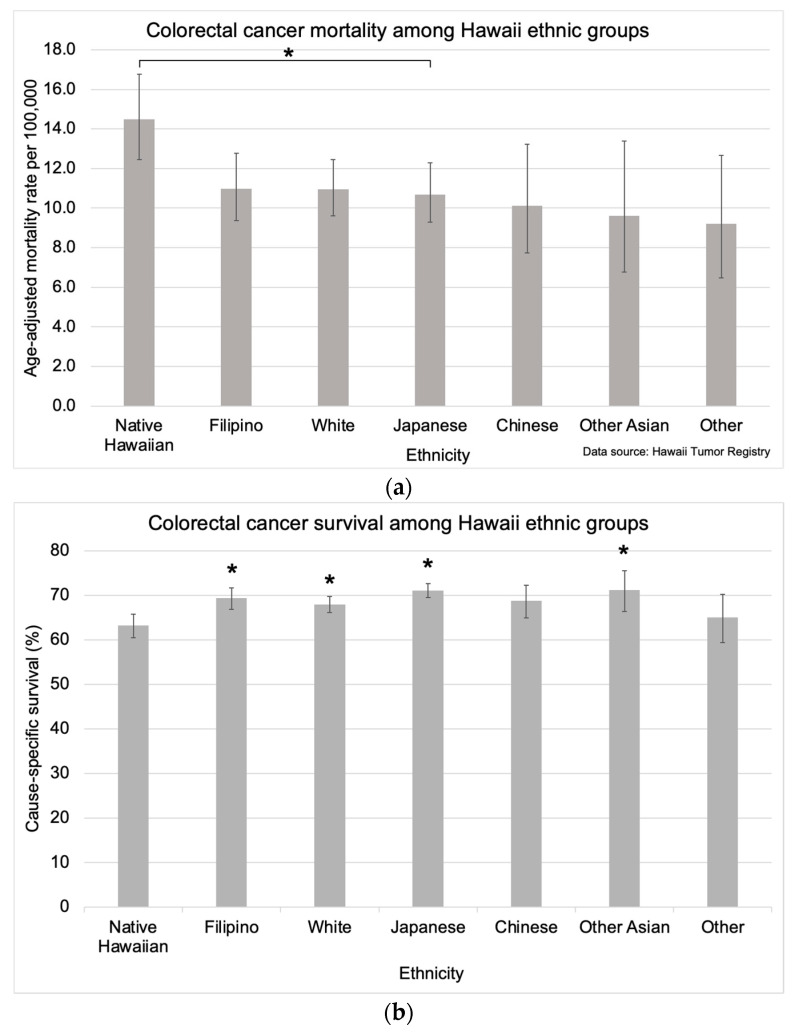
Figure 6.
Colorectal cancer-specific (a) mortality and (b) survival in Hawaii by ethnicity. Mortality calculations were limited to data available from 2015–2019, and data for survival calculations was available from 2000–2018 with follow-up through 2019. The asterisk (*) indicates a significant difference from the mortality rate of Native Hawaiians. Five-year mortality rates were age-adjusted to the 2000 US Standard Population.

