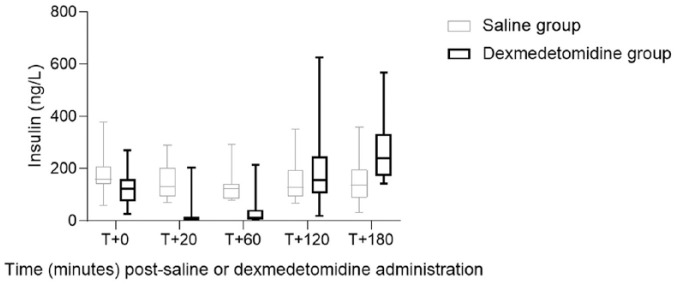
Figure 2.
Box plot comparison of insulin concentration after dexmedetomidine or saline administration in eight healthy cats. Error bars represent range, interquartile range and median insulin concentration within a treatment group. No significant difference (P <0.05) was noted within or between groups

