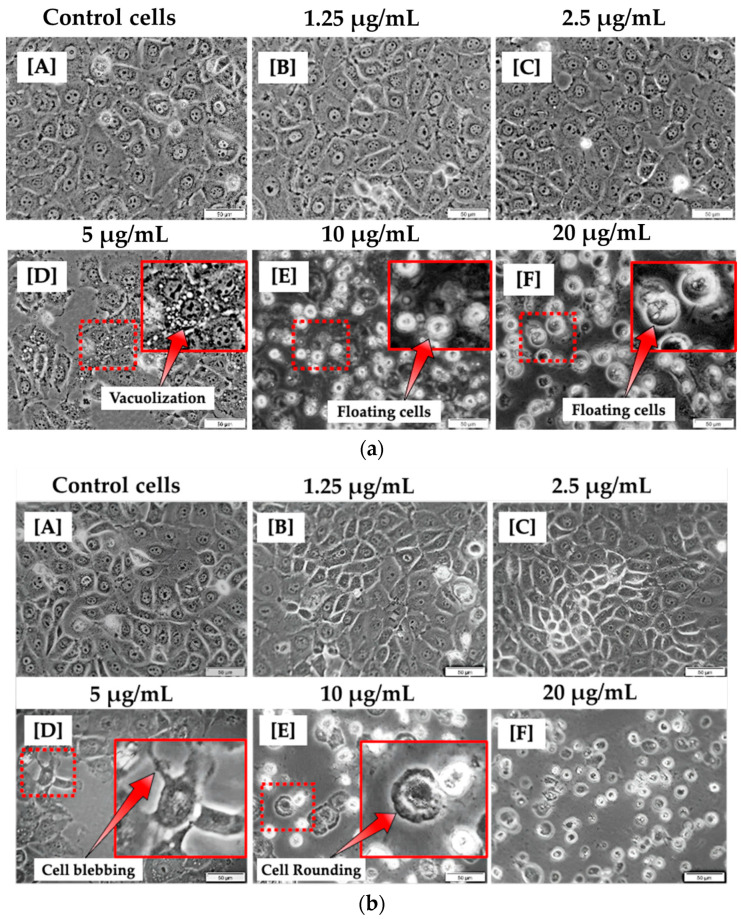
Figure 1.
Morphological analysis of MCF-7 cells 12 h (a) and 24 h (b) post treatment with varying concentrations of CBD (A–F). No morphological changes were observed in MCF-7 cells treated with 1.25 and 2.5 μg/mL (B,C). However, morphological changes were observed in MCF-7 cells treated with 5, 10, and 20 μg/mL of CBD (D–F) when compared to control cells (A). (100× magnification and scale bar: 50 μm).

