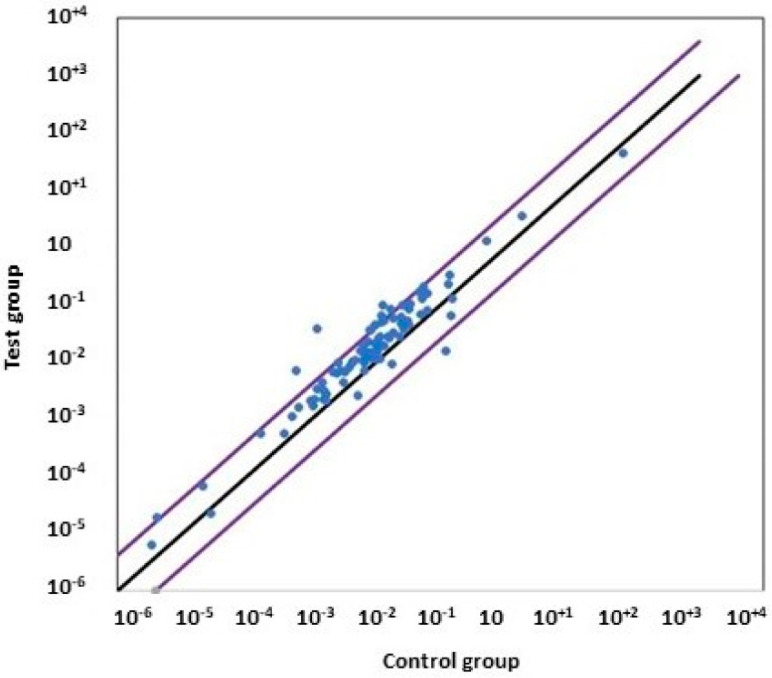
Figure 9.
Gene modulation when MBTP1 is inhibited in native CFBE41o-cells. Untreated and treated cells were subjected to a qPCR-Array (n = 6) aimed to assess 84 genes involved in the UPR (blue dots). The image is a scatterplot showing the gene distribution of each gene modulation by comparing data from untreated and treated cells. The x axis is the 2−Δct of the control group, and the y axis is the 2−Δct of the test group. Most of the genes were upregulated when MBTP1 was inhibited. According to our selective criteria delimited with purple diagonal bars, seven genes were found to be overexpressed, and three genes were found to be downregulated. The black diagonal represents the absence of modulation.

