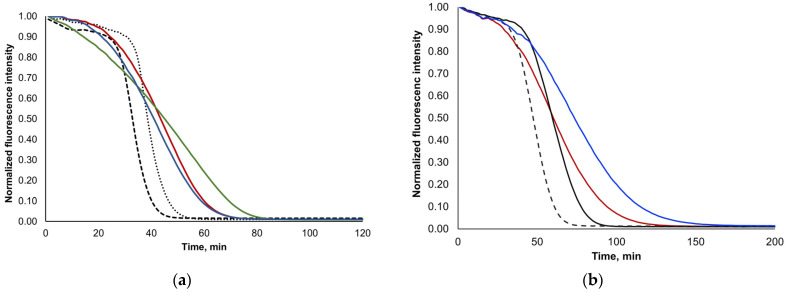
Figure 2.
ORAC curves obtained for (a) the standard antioxidant compounds oleuropein (10 μM, dashed black line), hydroxytyrosol (8 μM, dotted black line), rutin (10 μM, solid red line), luteolin (10 μM, solid blue line) and quercetin (9 μM, solid green line) and for (b) samples 4 (solid red line), 5 (solid black line), 7 (dashed black line) and 8 (solid blue line) analyzed at the same dilution.

