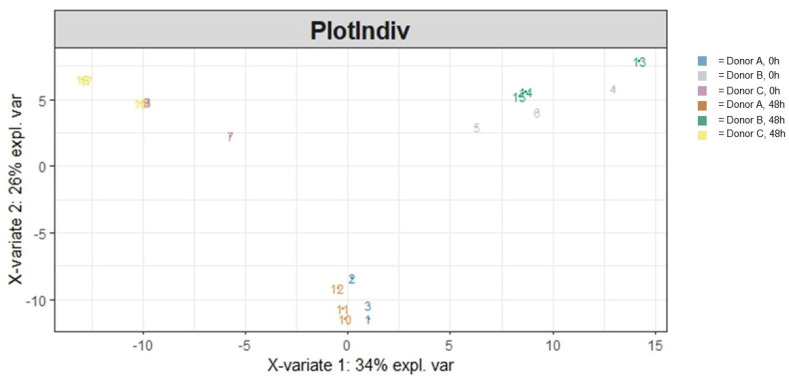
Figure 2.
A PLS-DA ordination visualizing the effects of treatment and donor influencing community structural heterogeneity following 48 h of colonic simulation. Numbers 1 through 9 refer to AG1-treated samples and numbers 10 through 18 refer to blank-control-treated samples. Numbers 1 through 3 and 10 through 12 refer to Donor A, numbers 4 through 6 and 13 through 15 refer to Donor B, and numbers 7 through 9 and 16 through 18 refer to Donor C.

