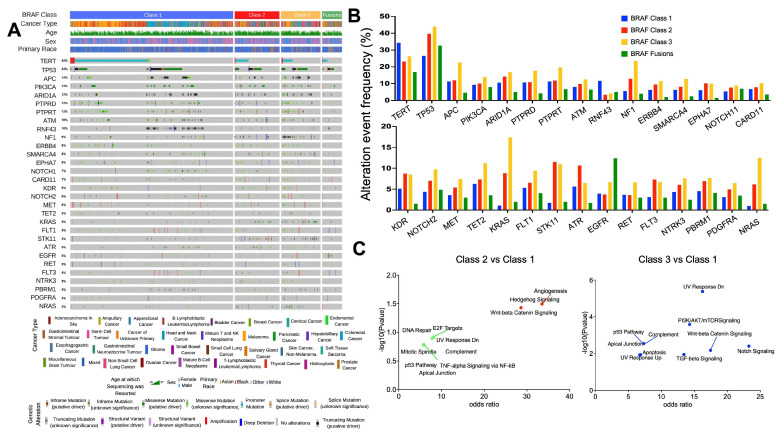
Figure 1.
The genomic landscape of BRAF mutant tumors. (A) Oncoprint highlighting the top 30 most frequent genes that are differentially altered between tumors with Class 1/2/3 BRAF mutations. (B) Histogram highlighting the incidence of gene alterations within each BRAF class. (C) The filtered list of genes that were significantly differentially altered according to BRAF Class 1/2 and 1/3 status across all cancers (n = 18 and n = 59, respectively, Q < 0.05) was subjected to pathway analysis using the MSigDB Hallmark algorithm. Pathways that were over-represented in this list of genes are indicated in blue, red, and green (p < 0.05 and Q < 0.05, p < 0.05, Q < 0.2, and p < 0.2 and Q < 0.2, respectively).

