Figure 3.
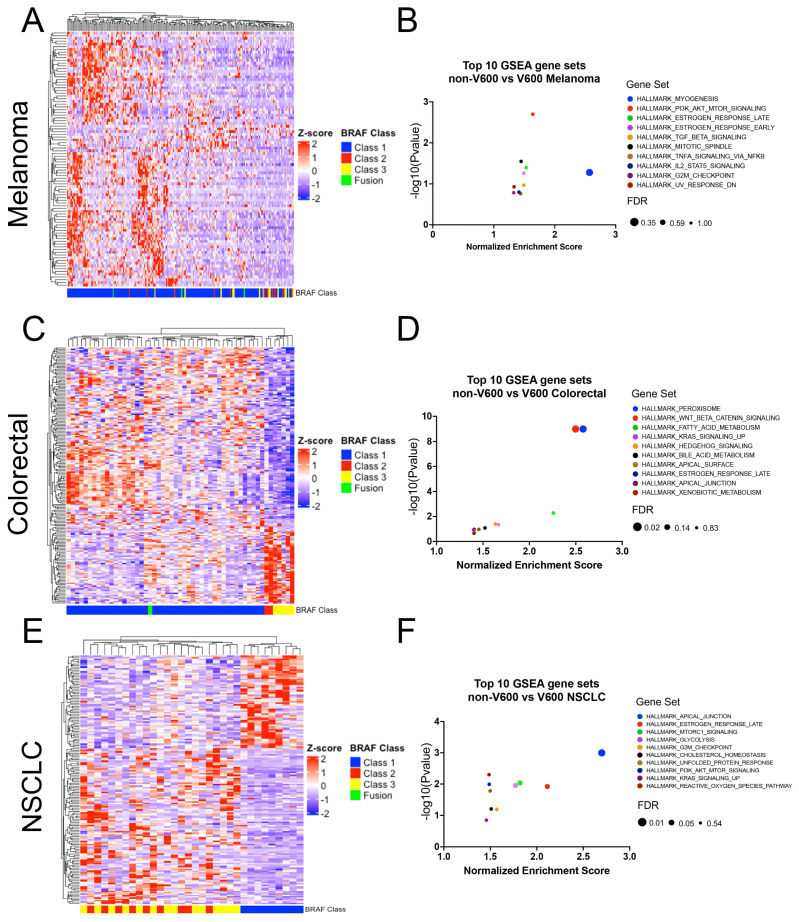
The transcriptomic landscape of BRAF mutant tumors. (A) Heatmap of the differentially expressed genes (n = 93) in Class 1 (V600) vs. Class 2/3/Fusion (non-V600) BRAF mutant melanoma tumors (TCGA, n = 195 samples). (B) Top 10 GSEA gene sets enriched in non-V600 BRAF mutant melanoma tumors. (C) Heatmap of the differentially expressed genes (n = 182) in BRAF mutant V600 vs. non-V600 colorectal tumors (TCGA, n = 53 samples). (D) Top 10 GSEA gene sets enriched in non-V600 BRAF mutant colorectal tumors. (E) Heatmap of the differentially expressed genes (n = 160) in V600 vs. non-V600 BRAF mutant NSCLC tumors (TCGA, n = 32 samples). (F) Top 10 GSEA gene sets enriched in non-V600 BRAF mutant NSCLC tumors. Genes plotted for each heatmap can be found in Supplementary Tables S19–S21.

