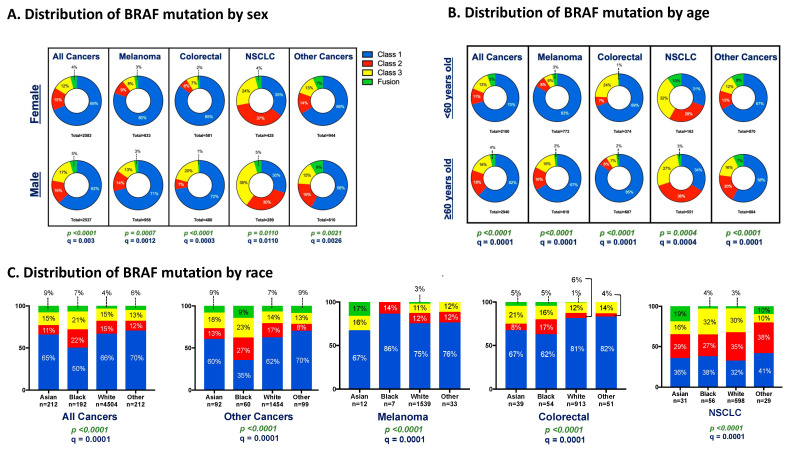
Figure 4.
Distribution of BRAF mutation class according to sex, age, and race across cancer type. The frequency of each BRAF class is shown in subgroups defined by sex (A), age (B), and primary race (C) among all patients, melanoma, CRC, NSCLC, and all other cancers (all patients excluding melanoma, CRC, and NSCLC). Values shown within each category represent the proportion of patients expressing each BRAF Class within cancer types according to sex (A), age (B), and primary race (C). p-value was calculated through the chi-square test for each contingency table and was then corrected using the Benjamini–Hochberg method to determine false discovery rate–corrected q value, which was considered significant when q was less than 0.05.

