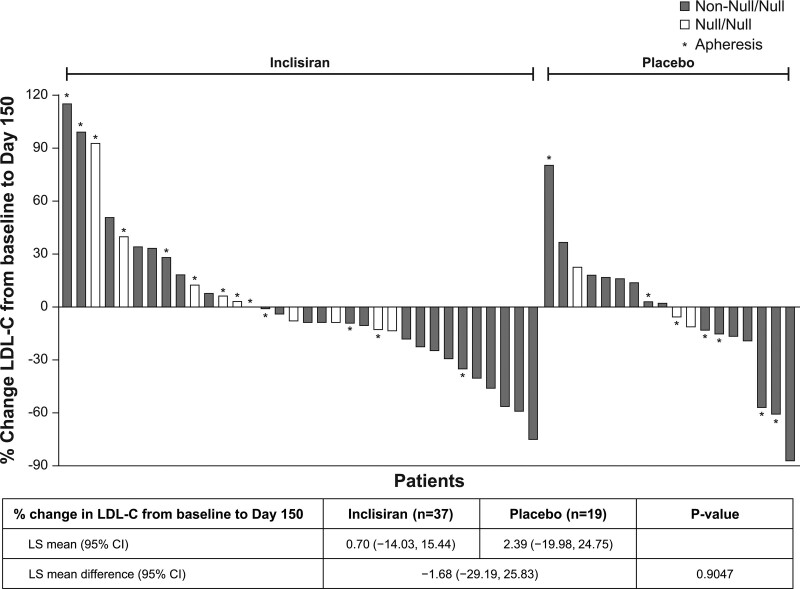
Figure 1.
Waterfall plot of percentage change in LDL-C level from baseline to day 150 for patients with LDL-C data (intent-to-treat population). Reflexive low-density lipoprotein cholesterol (LDL-C) was used for the analysis. The total number of observed cases was 52. A multiple imputation washout model was used for missing data imputation with 100 total imputed data sets. ANCOVA on each of the 100 data sets was performed by including the fixed effect for double-blind treatment and baseline LDL-C as a covariate, assuming unequal variances between treatment groups. Treatment effects from the 100 analyses were combined using the Rubin method. LS indicates least squares.

