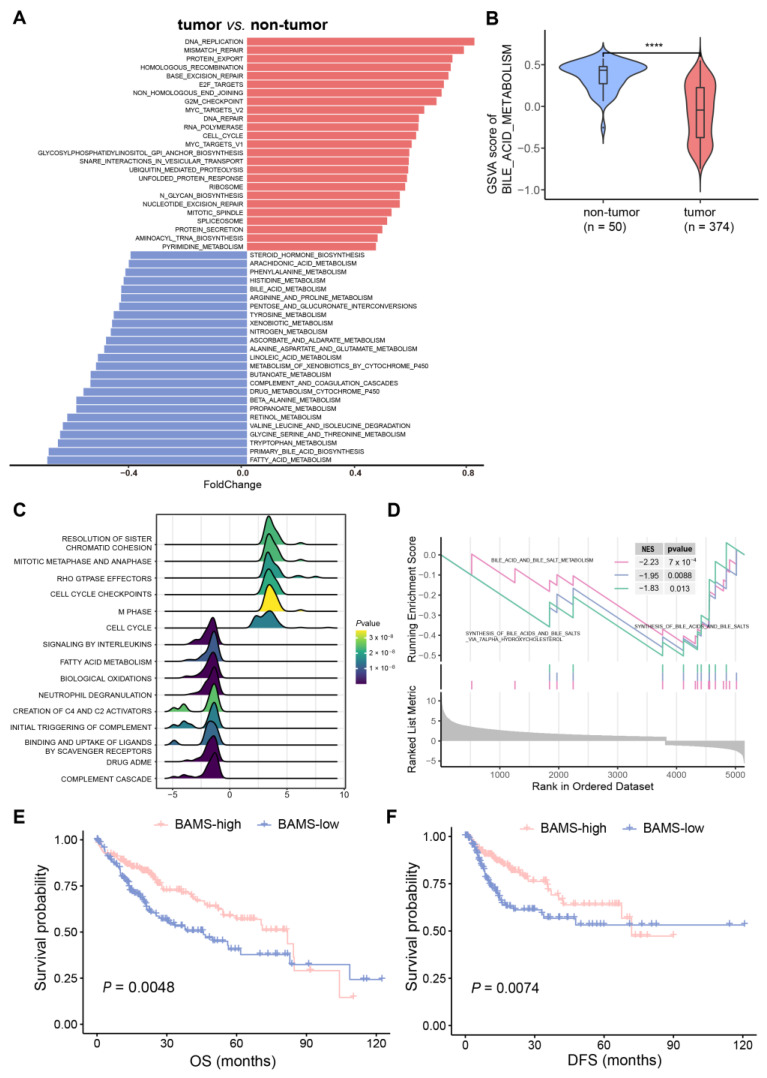
Figure 1.
Characteristics of bile acid metabolism in hepatocellular carcinoma (HCC). (A) Alteration pathways in the samples from the tumor (n = 374) versus non-tumor (n = 50) samples of TCGA-LIHC cohort. Upregulated and downregulated pathways are indicated in red (right) and blue (left) bars. Foldchange was calculated using the R package “limma (v. 3.58.1)”. (B) Gene set variation analysis (GSVA) showed that bile acid metabolism was downgraded in HCC compared to the non-tumor samples. In the violin plots, the middle bar represents the median, and the box represents the interquartile range (the 25th and 75th percentiles); the vertical line denoted 1.5 times the interquartile range. p-values are calculated via the Wilcoxon rank-sum test (**** p < 0.0001). The results of GSEA analysis illustrated in (C) the top 15 pathways with the largest |NES| and (D) BA metabolism-related gene set enrichment. Kaplan–Meier curves of overall survival (OS) (E) and disease-free survival (DFS) (F) for BAMS-high and BAMS-low of TCGA-LIHC cohort.

