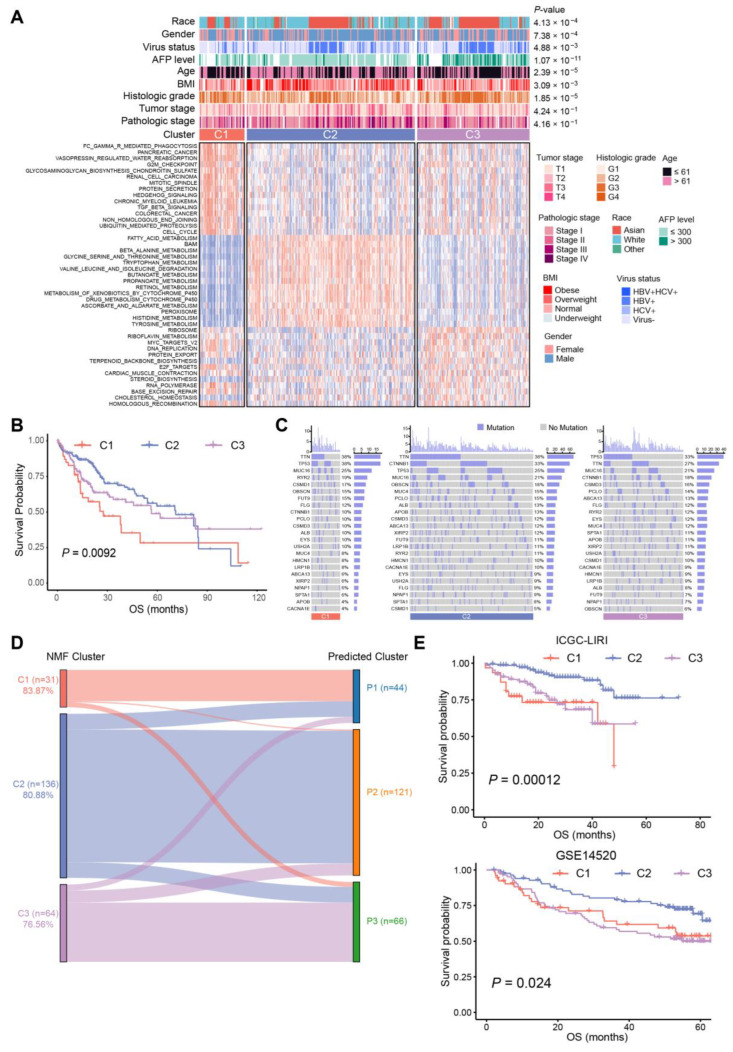
Figure 2.
Subtypes of 368 HCC samples and association with clinical characteristics. (A) Heat map of alteration pathways in three subtypes identified via non-negative matrix factorization (NMF) consensus clustering (tumor samples, n = 368): C1 (red, n = 51), C2 (blue, n = 190), and C3 (purple, n = 127). Clinical characteristics are shown above with p-values calculated using a chi-square test. Underweight: body mass index (BMI) <18.5; normal: 18.5 ≤ BMI ≤ 25; overweight: 25 < BMI ≤ 30; obese: BMI > 30. (B) Kaplan–Meier curves of OS for each subtype of TCGA-LIHC cohort. (C) Oncoprint of gene mutation in the three subtypes of TCGA-LIHC cohort, purple for mutation and grey for no mutation. (D) Comparison of subtypes between NMF clusters and predicted clusters of ICGC-LIRI cohort depicted in the Sankey diagram. The height of each linkage line represents the number of samples. (E) Kaplan–Meier curves of OS for subtypes identified by NMF in the ICGC-LIRI cohort (top) and predicted subtypes in GSE14520 (bottom).

