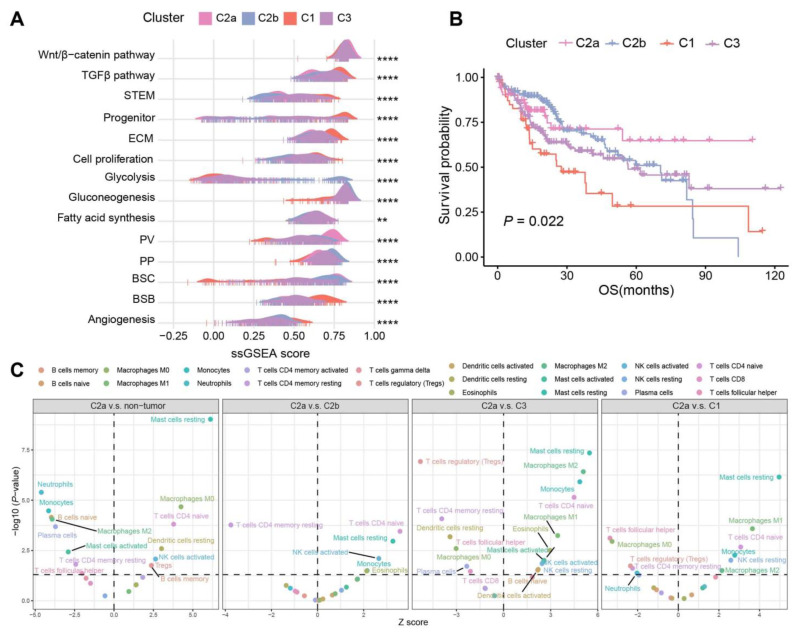
Figure 4.
Subtypes and signatures of TCGA-LIHC. (A) Association between the four subtypes and HCC signatures depicted in the ridge plot. (B) Kaplan–Meier curves of OS for the four subtypes in HCC samples. (C) CIBERSORT inferred immune cell populations between C2a, non-tumor samples, and other subtypes. p values were calculated via Wilcoxon rank-sum test and p < 0.05 was statistically significant (dotted lines on the y axis). Only the significant cell types were labeled. **** p < 0.0001, ** p < 0.01.

